PTE Speaking Line Graph: Strategy, Template and Tips
PTE Speaking
A line graph on the PTE Speaking screen rewards one habit above all: say the trend before the details. The line graph arrives as the image in a Describe Image item, which gives you 25 seconds to read its trend and 40 seconds to describe it. Pearson's Describe Image rules decide your timing and your score.
Pearson publishes no line-graph-specific rules. The method below applies Pearson's own advice to line graphs: identify the key trends and the most significant change, use numbers from the image without reading every point, and end with a conclusion. Twelve worked answers follow, from a single rising line to three lines and a bar-plus-line chart.
Table of Contents
Where Do Line Graphs Appear in PTE?
In PTE, a line graph is one image type the Describe Image item can show, plotting how one or more values change over time. It appears in Part 1 Speaking & Writing of both PTE Academic and PTE Core.
A line graph plots values as points joined by a line, usually with time along the bottom. Pearson's Score Guides list 5-6 Describe Image items in PTE Academic and 3-4 in PTE Core, but no Pearson page lists the chart types, so no one can promise how many line graphs you'll get. Pearson's own examples are a map of Africa on the Academic page and a graph of New Zealand exports on the Core page, so treat the line graph as one image type among several.
How Does the Line Graph Task Work Before You Speak?
The graph appears, you get 25 seconds to study it, a short tone opens the microphone, and you have 40 seconds to speak, recorded once. Six checks fit inside the 25 seconds, and each one gives you something to say.
| In the 25 seconds | What to notice |
|---|---|
| Title | What is measured, and where |
| Time axis | The start and end points |
| Value axis | The unit, such as percent or thousands |
| Overall direction | Up, down, flat or mixed |
| Peak and low point | The highest and lowest values |
| Most significant change | The steepest rise or fall |
Pearson's tip is to ask two questions, "What is the main idea?" and "What are the details?", and to note key ideas on the erasable noteboard. Write the units and the time frame there too, because your first sentence needs both.
A simple 25-second split helps as a practice habit, though it isn't a Pearson rule. Use seconds 1-5 for the title and both axes, and seconds 5-15 for the overall direction, peak, low and biggest change. Spend seconds 15-25 rehearsing your opening sentence, so you start right after the tone.
How Does Scoring Affect Your Line Graph Response?
A line graph answer is scored on Content, Pronunciation and Oral Fluency, like any Describe Image answer, with partial credit. Content rewards the main trend, the relationships between points or lines, and a conclusion or implication. Pearson's PTE Academic page says all three traits are AI-scored, and a human expert also reviews Content before the task score is confirmed. Each trait has a line-graph meaning.
- Content: the overall trend, the peak, the low point, the biggest change and a conclusion.
- Pronunciation: years, numbers and units said clearly, with correct word stress.
- Oral Fluency: a constant, natural pace through the trend, with no hesitations or restarts.
Some prep sites say delivery counts more than exact numbers and tell you to skip them. Pearson's own Describe Image article says to incorporate numbers from the image, while not trying to mention every feature. Follow Pearson: name the key figures, not every point.
Pearson's PTE Academic Score Guide scores Content from 0 to 6 and Pronunciation and Oral Fluency from 0 to 5 each, and counts Describe Image toward Speaking only; the PTE Core Score Guide scores Content from 0 to 5. Its top Academic Content level asks for a full, accurate description that expands on the relationships between features, so a listener could picture the whole graph.
Graph words carry stress traps, and Pronunciation scores word stress. The capitals mark the stressed syllable.
| Word or number | Say it as |
|---|---|
| percentage | per-CEN-tage |
| increase | IN-crease (noun), in-CREASE (verb) |
| decrease | DE-crease (noun), de-CREASE (verb) |
| fluctuate | FLUC-tu-ate |
| 2015 | "twenty fifteen" |
| 2005 | "two thousand and five" or "two thousand five" |
| 3,400 | "three thousand four hundred" |
| 4.6% | "four point six percent" |
Is There a Line Graph Template for PTE?
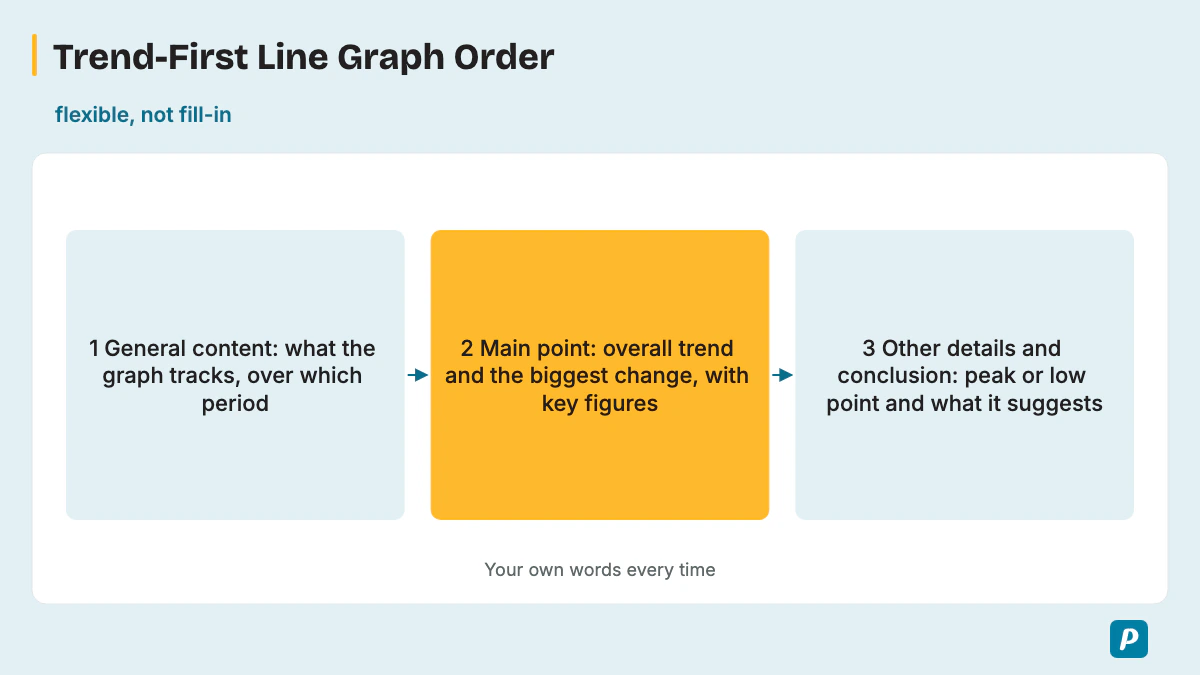
Not a fill-in line graph template: Pearson says memorized responses or templated sentences can lead to a score of 0 for Content, and then Fluency and Pronunciation aren't scored either. Pearson's Academic page also gives no credit for an unoriginal response. A flexible trend-first order is the safe alternative, built from Pearson's three parts.
- General content: say what the graph tracks and over which period.
- Main point: give the overall trend and the most significant change, with key figures.
- Other details and conclusion: add the peak or low point and what the trend suggests.
Fixed slots such as 0-10, 10-30 and 30-40 seconds circulate online, but Pearson gives only the 40 seconds and the three-part order, so treat those slots as a rough pacing guide at most.
What Trend Vocabulary Describes a Line Graph?
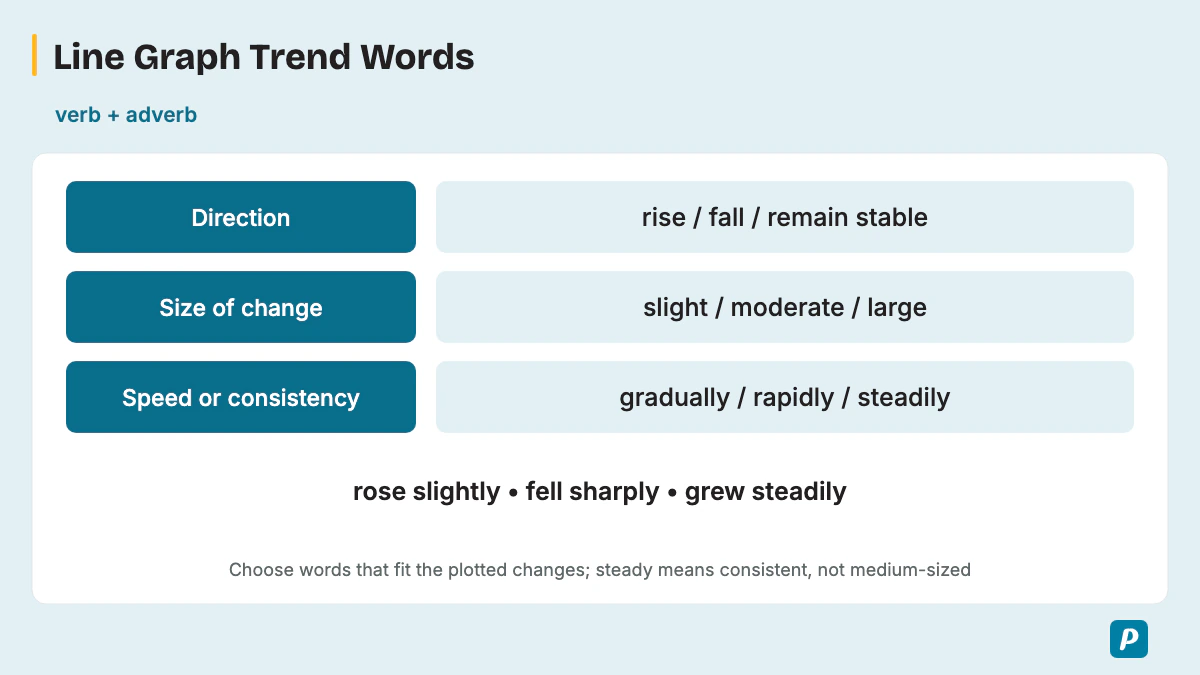
A line graph answer runs on trend verbs (rise, fall, fluctuate, peak), the adjectives and adverbs that show how fast or how much (sharp, gradual, slightly), and time phrases. Two or three lines also need comparison words.
| Movement | Verbs | Noun forms | Example sentence |
|---|---|---|---|
| Upward | rise, increase, climb, grow, surge | a rise, an increase, growth | "Downloads rose from 5,000 to 36,000." |
| Downward | fall, decrease, decline, drop, plunge | a fall, a decrease, a drop | "Subscriptions fell to 50,000 in 2023." |
| No change | remain stable, level off, plateau, stabilize | a plateau, a period of stability | "Ownership leveled off at about 83%." |
| Ups and downs | fluctuate, vary | a fluctuation | "Attendance fluctuated between 26,000 and 45,000." |
| Highest and lowest | peak at, reach a high of, hit a low of, dip to | a peak, a low, a dip | "Visits peaked at 3,400 in April." |
Intensity words describe size or speed, not direction. Every word in the next table pairs with an upward verb or a downward verb.
| Size or speed of change | Adjectives | Adverbs | Example (rise and fall) |
|---|---|---|---|
| Large or fast | sharp, rapid, dramatic, significant | sharply, rapidly, dramatically, significantly | "rose sharply" / "a sharp fall" |
| Medium or even | moderate, steady | moderately, steadily | "grew steadily" / "a steady decline" |
| Small or slow | slight, gradual, marginal | slightly, gradually, marginally | "increased slightly" / "a gradual drop" |
Two or three lines need comparison language. Pick the phrase for the relationship you see.
| Phrase | Use it when |
|---|---|
| while, whereas | two lines move in different ways in one sentence |
| in contrast | the second line does the opposite of the first |
| meanwhile | two changes happen over the same years |
| overtakes, overtook | one line crosses above another |
| remains higher throughout | one line leads for the whole period |
| catches up with | a lower line closes the gap |
| the gap widens, the gap narrows | the distance between lines changes |
| converge, follow a similar pattern | the lines move together |
Time phrases tie each change to the axis, and approximation words handle points that sit between gridlines.
| Type | Phrases |
|---|---|
| Time phrases | over the period, from ... to ..., between ... and ..., by the end of, in the first half, at the start of, throughout |
| Approximation | approximately, roughly, about, just over, just under, nearly, close to |
Pair a verb with an adverb and a figure in one sentence instead of listing words. "Sales rose sharply to 500 in March" says more than three separate trend words. Match the tense to the data: past tense for past years ("visits fell"), present tense for undated figures ("the line peaks in July").
How Do You Describe Different Types of Line Graphs?
A single-line graph is described trend first. For multiple lines, say what the lines compare, give each line's direction in one clause, then name the one point where they meet, cross or diverge most. Line graphs come in single-line and multi-line forms, plus the combination chart that adds bars, and the shape of the line decides what you say first.
| Shape | What to say first | Useful words | Sample |
|---|---|---|---|
| Steady rise or fall | Start, end and the even rate | steadily, by ... each year | 2, 3 |
| Speeding-up rise | The final, largest jump | accelerated, sharply | 4 |
| Rise then fall | The peak and the biggest change | peaked at, declined | 1 |
| Fluctuating line | The range between high and low | fluctuated between | 5 |
| Rise then level off | When the growth stopped | leveled off, plateaued | 6 |
| Spike or reversal at the end | The long trend, then the final break | rebounded, jumped | 7 |
| Two lines crossing | The crossing point | overtook | 8 |
| Two lines moving apart | How the gap changed | the gap widened, diverged | 9 |
| Three lines, one leader | The line that stays on top | remained higher throughout | 10 |
| Combination chart | The bars, then the line, then the link | in line with | 11 |
For two or three lines, four steps keep the comparison inside 40 seconds.
- Name the lines and what they compare.
- Give one clause per line on its overall direction.
- Point out the most significant crossing point or gap, where the lines diverge most.
- Close with one comparison-based conclusion.
Pearson's tip not to mention every feature matters most here, because three lines carry too many points for 40 seconds. A combination chart uses two value axes, so say which measure the bars show and which the line shows before you link them. Some sites list a "parallel line graph" as a third type; describe it with the same multi-line steps.
What Are Common Line Graph Mistakes?
The costly mistakes are reading every data point, describing small details before the main trend, skipping numbers altogether, adding opinions and stopping before a conclusion. Most of them cost Content or Oral Fluency.
- Reading every one of the data points uses up time and leaves no conclusion, which costs Content.
- Starting with small details buries the main trend, which also costs Content.
- Giving no figures at all goes against Pearson's advice to incorporate numbers.
- Reading time labels aloud as a list wastes seconds; Pearson says not to spend too long on labels.
- Personal opinions aren't in the graph, and Pearson says to avoid them.
- A memorized template can drop Content to 0, and then Fluency and Pronunciation aren't scored.
- Restarts after a wrong number lower Oral Fluency, so correct yourself in the next clause and keep going.
- Vague time words hide the trend: say "rose sharply between 2021 and 2022", not "rose after a while".
- Casual verbs such as "goes up" and "goes down" sound weaker than rise, increase, fall and decline.
- Missing the units or the time frame leaves the figures without meaning, so name both in your first sentence.
- A trend word that doesn't fit the data is a Content error: check whether the gaps between points grow, shrink or stay similar before you say "steadily".
What Does a Line Graph Sample Answer Look Like?
A sample answer names what the graph tracks, gives the overall trend with a key figure or two, then the most significant change, the peak or low point and a conclusion, in about 30-40 seconds. Every practice graph here uses made-up data written for practice, not real statistics, and none of them is a real exam question. Each model answer uses only the figures in its own table.
Practice graph 1: monthly visitors to a city aquarium (single line, rise then fall)
| Jan | Feb | Mar | Apr | May | Jun |
|---|---|---|---|---|---|
| 2,000 | 2,200 | 2,600 | 3,400 | 3,000 | 2,500 |
The line graph shows monthly visitors to a city aquarium from January to June. Visitor numbers rose for three months and then fell. Growth was slow at first, from 2,000 in January to 2,600 in March, before a jump of 800 took visits to a peak of 3,400 in April, the biggest change on the graph. After that, visits declined to 3,000 in May and 2,500 in June. Overall, the aquarium ended June with 500 more visitors than in January.
In this annotated answer, the first sentence is General content. The second and third sentences are the Main point: the overall trend, then the most significant change with its size, using the trend words "rose", "a jump of" and "a peak of". The last two sentences give Other details and the conclusion, with "declined" for the fall and a closing figure checked against the table (2,500 minus 2,000).
Practice graph 2: electric buses in one city's fleet (steady rise)
| 2019 | 2020 | 2021 | 2022 | 2023 | 2024 |
|---|---|---|---|---|---|
| 40 | 55 | 70 | 85 | 100 | 115 |
The line graph shows the number of electric buses in one city's fleet from 2019 to 2024. The fleet grew steadily, adding exactly 15 buses every year. It started at 40 buses in 2019, reached 70 in 2021 and 100 in 2023. The highest figure was 115 buses in 2024, at the end of the period. Overall, the fleet almost tripled between 2019 and 2024, with no year of decline.
Practice graph 3: landline subscriptions in one region, thousands (steady fall)
| 2018 | 2019 | 2020 | 2021 | 2022 | 2023 |
|---|---|---|---|---|---|
| 90 | 82 | 74 | 66 | 58 | 50 |
The line graph shows landline phone subscriptions in one region from 2018 to 2023, in thousands. Subscriptions fell steadily, losing 8,000 every year. They started at a high of 90,000 in 2018 and dropped to 66,000 by 2021. The decline continued to a low of 50,000 in 2023. In total, the region lost 40,000 subscriptions, or about 44% of the 2018 figure.
Practice graph 4: monthly downloads of a study app, thousands (speeding-up rise)
| Jan | Feb | Mar | Apr | May | Jun |
|---|---|---|---|---|---|
| 5 | 6 | 8 | 12 | 20 | 36 |
The line graph shows monthly downloads of a study app from January to June, in thousands. Downloads rose every month, and the growth accelerated. The monthly gain doubled each time, from 1,000 in February to 8,000 in May. The most significant change came in June, when downloads jumped by 16,000 to a peak of 36,000. Overall, monthly downloads grew more than sevenfold, from 5,000 to 36,000.
Practice graph 5: monthly cinema attendance in one town, thousands (fluctuating line)
| Jan | Feb | Mar | Apr | May | Jun | Jul | Aug |
|---|---|---|---|---|---|---|---|
| 42 | 30 | 45 | 28 | 40 | 26 | 44 | 31 |
The line graph shows monthly cinema attendance in one town from January to August, in thousands. Attendance fluctuated sharply, rising and falling every month. The highest figure was 45,000 in March, while the lowest was 26,000 in June. Each high month, such as July at 44,000, was followed by a fall of more than 10,000. Overall, there was no clear upward or downward trend, and August ended at 31,000, below January's 42,000.
Practice graph 6: adults in one town who own a smartphone, % (rise then level off)
| 2016 | 2017 | 2018 | 2019 | 2020 | 2021 | 2022 | 2023 |
|---|---|---|---|---|---|---|---|
| 40 | 55 | 68 | 78 | 82 | 83 | 83 | 84 |
The line graph shows the percentage of adults in one town who owned a smartphone from 2016 to 2023. Ownership rose rapidly at first, from 40% in 2016 to 78% in 2019. The biggest single increase was 15 points, between 2016 and 2017. After 2019, growth slowed, and ownership leveled off between 82% and 84% from 2020 onward. In short, smartphone ownership more than doubled before reaching a plateau.
Practice graph 7: unemployment rate in one country, % (long fall, then a spike)
| 2015 | 2016 | 2017 | 2018 | 2019 | 2020 | 2021 | 2022 |
|---|---|---|---|---|---|---|---|
| 8.0 | 7.4 | 6.8 | 6.1 | 5.5 | 5.0 | 4.6 | 7.9 |
The line graph shows the unemployment rate in one country from 2015 to 2022. For six years the rate fell steadily, from 8.0% in 2015 to a low of 4.6% in 2021. In 2022, however, it jumped sharply by 3.3 points to 7.9%. This final spike was the most significant change on the graph. Overall, the rate ended almost back at its 2015 level, reversing nearly all of the earlier decline.
Practice graph 8: a retailer's online and in-store sales, $ million (two lines crossing)
| Year | Online | In-store |
|---|---|---|
| 2018 | 20 | 80 |
| 2019 | 28 | 74 |
| 2020 | 37 | 68 |
| 2021 | 45 | 60 |
| 2022 | 54 | 52 |
| 2023 | 62 | 47 |
| 2024 | 70 | 42 |
The line graph compares a retailer's online and in-store sales from 2018 to 2024, in millions of dollars. Online sales rose steadily, from $20 million to $70 million. In contrast, in-store sales declined every year, from $80 million to $42 million. The crossing point came between 2021 and 2022, when online sales overtook in-store sales at about $53 million. Overall, online sales more than tripled, while in-store sales almost halved.
Practice graph 9: average monthly rent in two cities, $ (two lines moving apart)
| Year | City A | City B |
|---|---|---|
| 2019 | 1,000 | 950 |
| 2020 | 1,080 | 960 |
| 2021 | 1,170 | 975 |
| 2022 | 1,260 | 980 |
| 2023 | 1,350 | 1,000 |
| 2024 | 1,450 | 1,010 |
The line graph compares average monthly rent in City A and City B from 2019 to 2024. In 2019 the two cities were close, at $1,000 and $950. After that, rent in City A climbed steadily to $1,450, whereas City B rose only slightly to $1,010. As a result, the gap widened from $50 to $440. Overall, City A's rent grew by $450, almost eight times City B's rise of $60.
Practice graph 10: yearly visitors to three parks, thousands (three lines, one leader)
| Year | North Park | River Park | Hill Park |
|---|---|---|---|
| 2020 | 120 | 60 | 40 |
| 2021 | 130 | 75 | 42 |
| 2022 | 140 | 70 | 38 |
| 2023 | 150 | 85 | 45 |
| 2024 | 160 | 95 | 50 |
The line graph compares yearly visitors to three parks from 2020 to 2024, in thousands. North Park remained the most visited throughout, rising steadily by 10,000 a year to 160,000. River Park grew from 60,000 to 95,000, despite a small dip to 70,000 in 2022. Meanwhile, Hill Park stayed the least visited, ranging only between 38,000 and 50,000. Overall, all three parks ended higher than they started, and North Park's lead over Hill Park grew from 80,000 to 110,000; its lead over River Park ended at 65,000, compared with 60,000 initially.
Practice graph 11: bike-share trips (bars, thousands) and average temperature (line, °C) (combination chart)
| Month | Mar | Apr | May | Jun | Jul | Aug |
|---|---|---|---|---|---|---|
| Trips, thousands (bars) | 18 | 25 | 34 | 41 | 45 | 39 |
| Temperature, °C (line) | 10 | 14 | 18 | 22 | 25 | 24 |
The combination chart shows monthly bike-share trips as bars and average temperature as a line, from March to August. Trips rose every month from 18,000 in March to a peak of 45,000 in July, then fell to 39,000 in August. The temperature line followed a similar pattern, climbing from 10 degrees to a high of 25 degrees in July before dipping slightly to 24 degrees. Overall, trips were highest in the warmest month, and the two measures moved together.
Practice graph 12: students at one college who study online, % (gridlines every 10, values read by eye)
| 2019 | 2020 | 2021 | 2022 | 2023 |
|---|---|---|---|---|
| about 12 | just under 40 | roughly 45 | about 35 | just over 30 |
The line graph shows the percentage of students at one college who studied online from 2019 to 2023. The share jumped from about 12% in 2019 to just under 40% in 2020, the most significant change on the graph. It peaked at roughly 45% in 2021. After that, the figure fell back to about 35% in 2022 and just over 30% in 2023. Overall, online study ended the period at more than twice its 2019 level.
How Do You Score High in a Line Graph Question?
To score high, lead with the overall trend, back it with two or three key figures, finish with a conclusion, and practice on single-line and multi-line graphs under real timing. Use a simple practice loop: take one graph, plan for 25 seconds, record for 40 seconds, then review the recording against Content, Pronunciation and Oral Fluency. Check that the recording names the biggest change and reaches the conclusion before the progress bar ends.
Summarize runs of points instead of reading each one. Say "the fleet grew by 15 buses every year, from 40 to 115" rather than listing all six values, because Pearson tells you to prioritize the most significant trends and data points within 40 seconds.
How Does the Line Graph Fit Into Describe Image?
The line graph is one image type inside Describe Image, so its timing and scoring come from that single task. Bar graphs, pie charts, tables, maps and process charts follow the same 25-second and 40-second rhythm. Our PTE describe image guide covers the task as a whole.
How Is a Bar Graph Different From a Line Graph?
A bar graph compares separate values, so its answer follows comparisons; a line graph shows change over time, so its answer follows the trend. When a bar graph runs across years, the trend verbs above work there too. The PTE bar graph guide sets out the comparison method with its own 12 samples.
How Is a Process Chart Different From a Line Graph?
A process chart primarily shows stages in order and may also include quantities or durations. Our guide on how to describe a process chart lists the sequence words that link them. The answer follows the stages to the final outcome, so Pearson's tip to incorporate numbers drives a line graph answer but rarely a process chart answer.
How Is a Change Map Different From a Line Graph?
A change map shows one place before and after development rather than a trend line. Our guide to describing a change map starts with what was added, removed or replaced, then names what stayed the same. Change phrases such as "was replaced by" and "remained" do the job that trend verbs do on a line graph.
How Do You Manage Time on a Line Graph Question?
Time on a line graph runs out when you narrate every point, so plan the trend and two or three figures in the 25 seconds and keep talking until the conclusion. Pearson's Describe Image article recommends speaking for 30-40 seconds, which leaves room for four or five short sentences inside the 40-second limit.
Pearson writes the 3-second rule in its Answer Short Question instructions and adds that it also applies to Describe Image. If you stop for three seconds while speaking, the recording status changes to "Completed" and you can't continue. Good time management therefore means never stopping for more than a second or two once you start. Read more on the 3-second rule in PTE speaking.
How Do You Practice Line Graph Samples?
Line graph practice works best on varied samples, single-line and multi-line, each recorded once under the real 25-second and 40-second timing. Use the 12 line graph samples above, then new graphs, with three drills.
- Daily non-stop drill: take one new graph, plan for 25 seconds and speak for the full 40 without stopping.
- Repetition: record one graph 3-4 times, fixing structure first, then fluency, then pronunciation.
- Shadowing: record one model answer at an even pace, then speak along with that recording until your timing matches it.
Keep every recorded practice attempt so you can compare the first and last versions of the same graph. Read about the benefits of online PTE practice with real timing.
How Do You Improve Oral Fluency for Line Graph Answers?
Oral fluency on a line graph improves when you say years, numbers and trend phrases at one even pace, without stopping to recheck a figure. Pearson rewards a constant, natural rate and says hesitations, repetitions and false starts lower the score.
Read the years and numbers from two practice tables above aloud in full sentences, such as "from 2,000 in January to 3,400 in April", until no figure makes you pause. Our guide to oral fluency in PTE adds more drills.
What Should You Do If You Get Stuck on a Line Graph?
If you lose your place or misread a figure, go back to the overall trend and move straight to your conclusion instead of restarting. Restarts are false starts, which Pearson says lower Oral Fluency, and a three-second silence can end the recording. For test-day nerves that make you freeze, see our guide to managing PTE exam anxiety.
Practice PTE Speaking on EasyEnglish
Try Speaking tasks in a timed, computer-based format like the real test.
Try speaking practice without signing up. A free account is required for full mock tests. Practice scores are estimates, not official Pearson scores.
Written by
EasyEnglish Team
The team behind EasyEnglish's PTE practice and mock tests
EasyEnglish provides PTE practice and independent preparation guides. Official test rules are checked against the sources identified in each guide; practice examples are illustrative, not real exam questions. Practice scores are estimates. Questions or corrections: support@inverseai.com. EasyEnglish is not affiliated with or endorsed by Pearson.
Editorial review completed .