PTE Speaking Process Chart: Process, Template and Tips
PTE Speaking
A box-and-arrow diagram has just appeared in PTE Speaking, and the clock is already running. That process chart, or flow chart, is the image in a Describe Image item: you get 25 seconds to trace its stages and 40 seconds to walk a listener from the first box to the last.
Pearson runs one Describe Image task and publishes no process-chart-specific rules, so every rule here is Pearson's Describe Image rule applied to a process. Pearson's Content trait rewards relationships, developments and conclusions, which on a process chart means saying how each stage leads to the next and what the process finally produces.
Table of Contents
What Is a Process Chart in PTE Describe Image?
In PTE, a process chart, also called a flow chart, is a diagram of stages joined by arrows, shown as the image in a Describe Image speaking item. It shows how something is made, how something happens in nature, or a cycle whose last stage feeds the first. You answer by naming the process, walking through the main stages in order, and ending with the outcome. Pearson describes one Describe Image task and doesn't treat process charts as a separate task, and both PTE Academic and PTE Core include Describe Image.
How Does the Process Chart Task Work?
The process chart appears on screen, you have 25 seconds to study it, the microphone opens after a short tone, and you have 40 seconds to speak, recorded once. The table sets out the timing and the rules for one item.
| Stage | Time or rule |
|---|---|
| Study the chart | 25 seconds |
| Short tone | Microphone opens after it |
| Speak | 40 seconds |
| Finish | Before the progress bar ends |
| Recording | Once only |
| Notes | Erasable noteboard |
| Items per PTE Academic test | 5-6 Describe Image questions (Score Guide) |
Pearson's PTE Academic Score Guide lists 5-6 Describe Image questions per test. It doesn't say how many of them are process charts, because the image can be any of the kinds Pearson names: "a graph, picture, map, chart or table."
What Types of Process Charts Appear in PTE?
Process charts fall into natural processes, manufacturing processes, life cycles and business processes. These are study groupings, not Pearson categories, because Pearson names no process types. What changes between them is the grammar you lean on.
- Natural process: the water cycle and similar charts call for cause and effect words such as "as a result" and "this causes".
- Manufacturing process: recycling, tea or coffee charts call for passive verbs such as "is collected" and "is sorted".
- Life cycle: a butterfly or frog chart calls for cycle words such as "then", "finally" and "the cycle begins again".
- Business or technical process: a hiring process, a budget cycle, a supply chain from maker to shop to recycler, or an official report process calls for active verbs that name who does each step.
Two shapes cut across all four kinds. A linear process runs from raw material to an end product, so your conclusion names that product. A cycle loops back to its first stage, so your conclusion says the cycle repeats.
How Do You Describe a Process Chart in PTE?
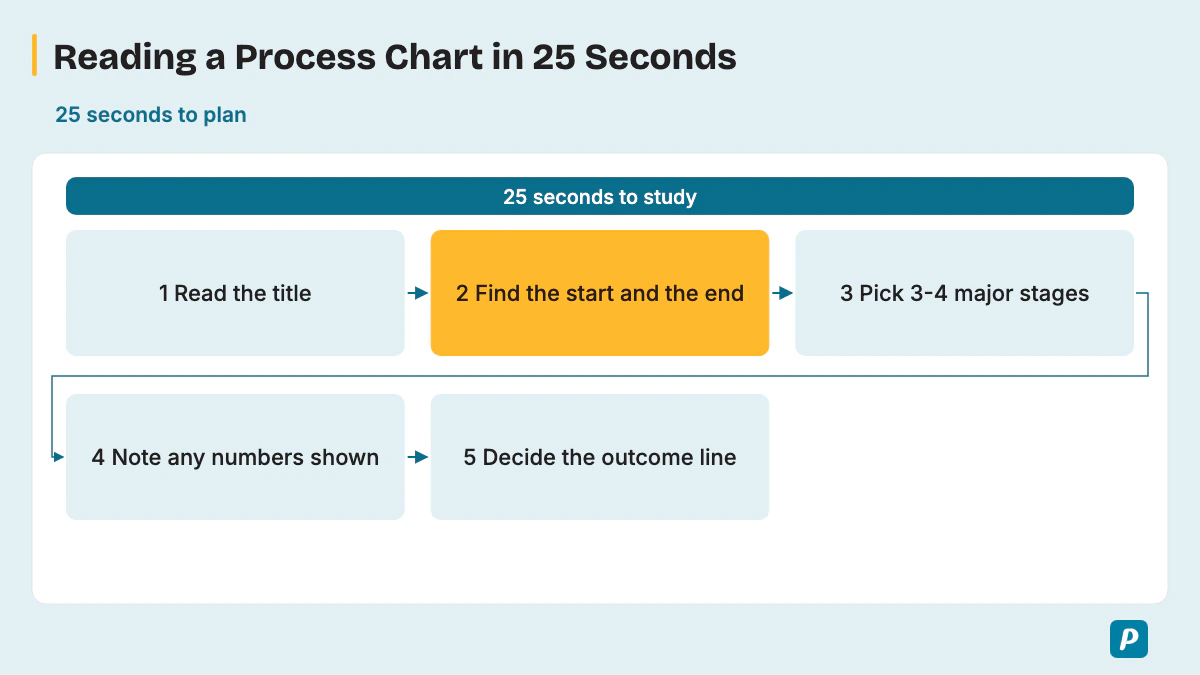
Read the title, find the start and end points, pick three or four major stages, and decide one line on the outcome before the tone. These five moves fit inside the 25 seconds of study time.
- Read the title to learn what process the chart shows, then plan to say it in your own words rather than read it out.
- Find the start point and the end point, following the arrows.
- Pick three or four major stages to describe in detail.
- Note any numbers the chart shows, since Pearson advises using numbers from the image when there are some.
- Decide your one-line conclusion on the outcome.
How much you cover depends on the size of the chart. A chart with 3 or 4 stages can be described in full. A chart with 6, 7 or more stages needs the key stages in detail and the minor ones grouped into a single clause, such as "after cleaning and crushing".
Pearson advises against trying to mention every feature and against spending too long on labels. Its 2021 speaking article adds two habits: always read the title, and if a word on the image is hard, "just say them how you think they should be said". If you miss a box while speaking, carry on to the next stage rather than going back.
The 40 seconds split into four parts, which comes to five to eight short sentences in the samples below. This plan is a practice guide, not a Pearson rule; Pearson's own target is 30-40 seconds of speech.
| Part | Seconds | What you say |
|---|---|---|
| Name the process | About 5 | "The flow chart shows how glass bottles are recycled." |
| Overview line | About 5 | "It starts with collection and ends with new bottles." |
| Stages | 20-25 | Three or four main stages, linked in order |
| Outcome | About 5 | What the process produces or why it repeats |
How Is a Process Chart Response Scored?
A process answer is scored exactly like any Describe Image answer: Content, Pronunciation and Oral Fluency, with partial credit. For a process, Content rewards the main stages, how each leads to the next, and the outcome or implication. Pearson's Score Guide gives each trait its own scale.
| Trait | Score Guide scale | What it means for a process chart |
|---|---|---|
| Content | Academic: 0-6; Core: 0-5 | Give the main stages in order, the links between them and the outcome. |
| Pronunciation | 0-5 | Say technical stage names clearly, as best you can. |
| Oral Fluency | 0-5 | Keep an even pace from stage to stage, with no going back. |
The Score Guide scores Content first. A Content score of 0 ends the scoring for that item, and the guide classes pre-prepared or memorized material as an irrelevant response. Content gets AI scoring plus a human review; if the AI and the human disagree, a second human makes the final judgment. Pronunciation and Oral Fluency are AI-scored only.
The Content descriptors show why a list of box labels scores low. Level 1 describes "disconnected elements, or a list of points identified on the image, without description or elaboration". Level 6 describes the image fully and accurately and expands on the relationships between its features. At that level, "A listener could build a complete mental picture of the image from the response."
Pearson's 2021 article makes the same point: "to score above 1" you include relationships between parts, possible developments and conclusions or implications.
Academic Content uses 0-6 and delivery traits 0-5 each. Core Describe Image uses Content 0-5; do not apply the Academic content descriptors to Core.
Is There a Process Chart Template for PTE?
Not a fill-in process chart template: Pearson says memorized responses or templated sentences can lead to a score of 0 for Content, and then Fluency and Pronunciation aren't scored. Pearson's three-part structure, applied to stages, does the job of a template safely.
- General content: say what process the chart shows, how many stages it has, and the overview line "It starts with X and ends with Y".
- Main point: walk from the first stages through to the end, in order.
- Other details and conclusion: add one detail, such as a repeat loop or a branch, then the final outcome.
Some prep sites still publish four-part fill-in process templates; Pearson's current advice says not to use templated sentences and to aim to speak for 30-40 seconds. It is the stages of this chart, not a stock sentence, that earn Content.
What Sequence Words Describe a Process Chart?
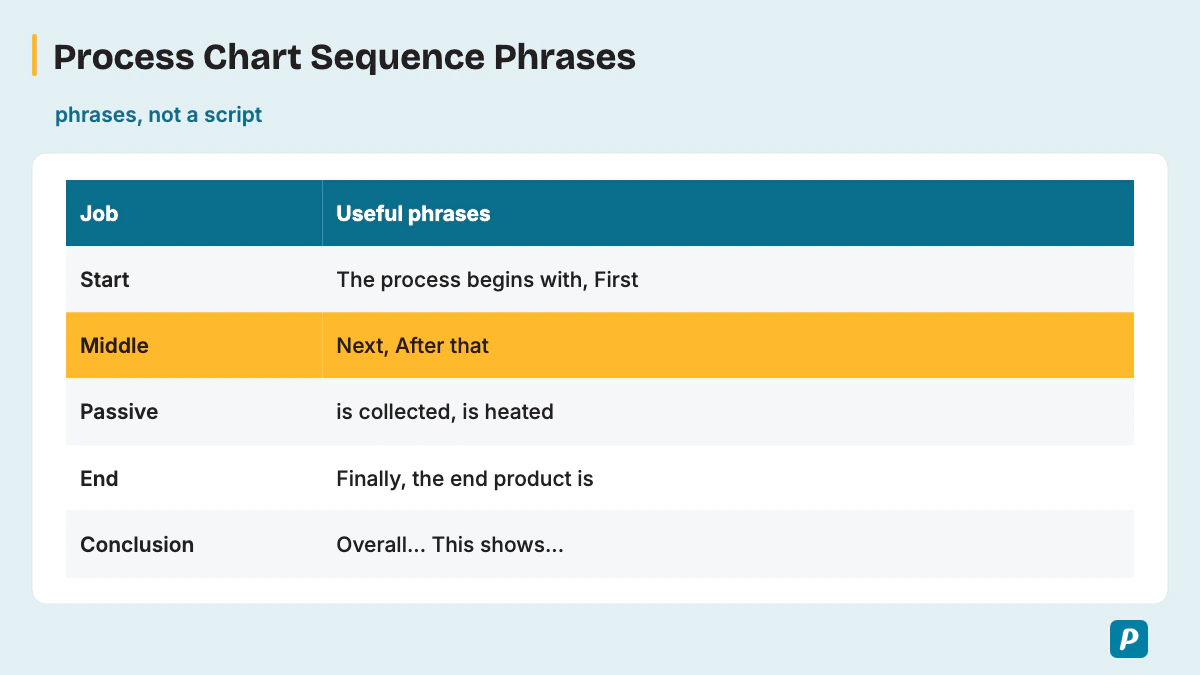
Process answers are held together by sequence words, passive verbs for processes run by people, and result words for the end stage. These phrases are grouped by the job they do in your answer.
| Job | Useful phrases |
|---|---|
| Name the process | "The flow chart illustrates how...", "The diagram shows the stages of..." |
| Start | "The process begins with", "First", "At the first stage" |
| Middle | "Next", "After that", "Once ... is ..., it is ...", "Following this" |
| Passive | "is collected", "is heated", "is transported" |
| End | "Finally", "the end product is", "At the last stage" |
| Conclusion | "Overall, the process has ... stages", "This shows..." |
| Linking | "also", "however", "as", "besides" |
| Process nouns | "stage", "step", "phase", "sequence", "procedure", "cycle", "workflow", "progression", "end product" |
The linking row comes from Pearson's 2021 article, which names "also, however, as or besides" as connector words. Fit these phrases into your own sentences; don't memorize a paragraph. The first stage takes "The process begins with", "after that" carries you through the middle, and "the end product is" closes a manufacturing chart.
The verb you pick for each stage matters as much as the sequence word. These 20 stage verbs cover most charts.
- Manufacturing: collected, sorted, cleaned, crushed, heated, melted, mixed, shaped, packed, transported.
- Natural: evaporates, condenses, falls, flows, collects.
- Life cycle: hatches, grows, develops, matures, lays.
What Are Common Process Chart Mistakes?
The costly mistakes are reading every box word for word, going back to fix a missed stage, never reaching the end, and skipping the outcome. Nine mistakes, each with the trait it costs.
- Reading every box label word for word produces "a list of points", which is the Score Guide's Content level 1.
- Backtracking to a missed box breaks the forward pace that Oral Fluency rewards.
- Running out of time before the last stage leaves Content incomplete.
- A memorized opening that ignores the chart risks a score of 0 for Content.
- No outcome or conclusion leaves Content short of its implication.
- Adding a personal opinion breaks Pearson's advice to "Stick to describing the elements you can see in the image."
- Speaking too fast blurs stage names and costs Pronunciation.
- Speaking too slowly leaves long gaps, which costs Oral Fluency; Pearson asks for "a smooth, natural speed".
- Choosing hard words you can't say smoothly costs Fluency: swap "Subsequently, the commodities undergo meticulous categorization" for "Next, the cans are sorted."
What Does a Process Chart Sample Answer Look Like?
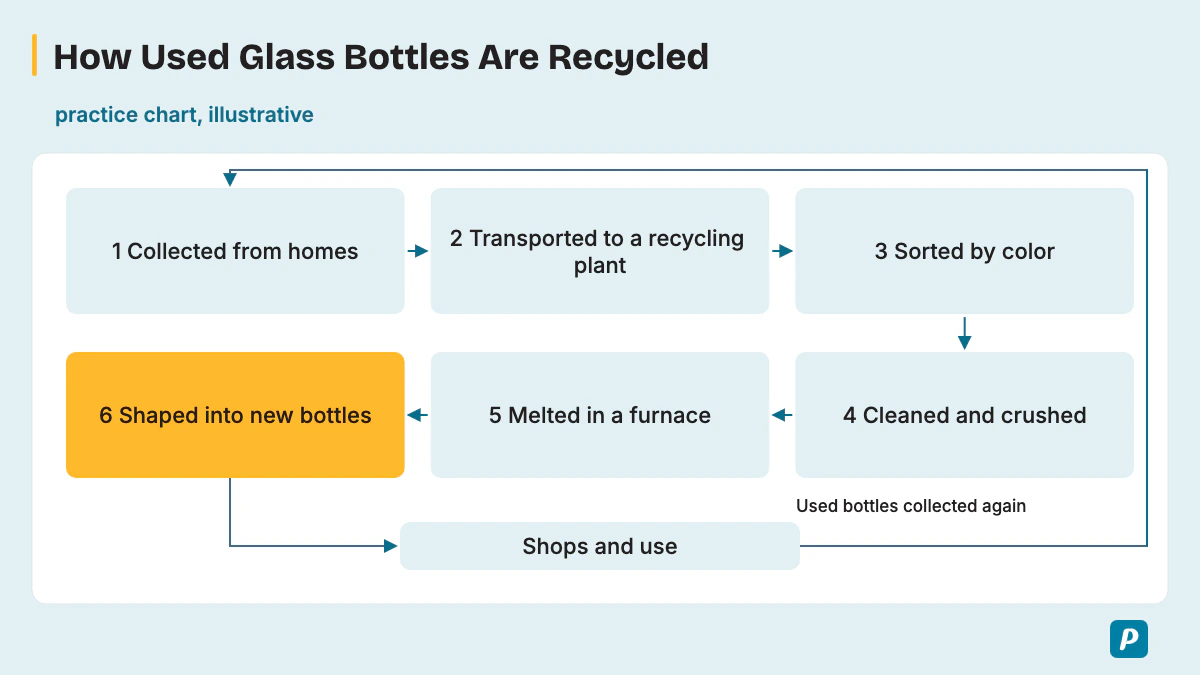
A sample answer names the process and the number of stages, walks through the main stages in order with sequence words, then gives the outcome as a conclusion, in about 30-40 seconds. All 12 practice charts below are illustrative, not real data, and both the charts and the answers are original practice material. None is a real exam question.
Sample 1: Glass bottle recycling (manufacturing, annotated)
Practice chart (illustrative, not real data): six stages. Bottles are collected from homes, transported to a recycling plant, sorted by color, cleaned and crushed, melted in a furnace, and shaped into new bottles that return to shops.
[General content] The flow chart illustrates how used glass bottles are recycled in six stages. It starts with collection from homes and ends with new bottles. [Main point] First, bottles are collected from homes and then transported to a recycling plant.
After that, they are sorted by color, and once they are clean, they are crushed into small pieces. Next, the pieces are melted in a furnace. [Other details and conclusion] Finally, the end product is new bottles, which go back to shops. Overall, the chart shows that glass is reused in a closed loop.
The annotated answer works part by part. The General content part names the process, the stage count and the overview line. The Main point carries the stages in chart order, with passive verbs such as "are collected". The last part adds the loop back to shops as its detail, then states the outcome, which is the relationship and conclusion that Content level 6 asks for.
Sample 2: Life cycle of a butterfly (life cycle)
Practice chart: four stages. Egg on a leaf, caterpillar (larva), chrysalis (pupa), adult butterfly, which lays eggs.
The diagram shows the four-stage life cycle of a butterfly, from egg to adult. The cycle begins when an egg is laid on a leaf. Next, a caterpillar hatches and feeds on leaves as it grows.
After that, the caterpillar forms a chrysalis, where its body changes completely. Finally, an adult butterfly comes out of the chrysalis and lays new eggs. Overall, the chart shows a cycle in which each adult starts the next generation.
Sample 3: Life cycle of a frog (life cycle)
Practice chart: four stages. Eggs (frogspawn) in water, tadpole with gills and a tail, froglet with legs and a shrinking tail, adult frog, which lays eggs in water.
The chart illustrates the life cycle of a frog in four stages. It begins with frogspawn, which is a mass of eggs laid in water. The eggs hatch into tadpoles, which breathe through gills and swim with a tail.
Next, the tadpole grows legs and its tail shrinks, so it becomes a froglet. Finally, it develops into an adult frog that can live on land. The adult returns to water to lay eggs, which restarts the cycle.
Sample 4: The water cycle (natural)
Practice chart: four stages in a loop. Evaporation from oceans and lakes, condensation into clouds, precipitation as rain or snow, collection in rivers, lakes, oceans and groundwater.
The diagram shows the water cycle, a natural process with four stages. First, the sun heats water in oceans and lakes, and it evaporates as water vapor. As the vapor rises, it cools and condenses into clouds.
This causes precipitation, so water falls as rain or snow. After that, the water collects in rivers, lakes, oceans and groundwater, where it evaporates again. Overall, the chart shows a continuous cycle that moves the same water between land, sea and sky.
Sample 5: Rainwater harvesting at home (natural and built)
Practice chart: five stages. Rain falls on the roof, gutters and a downpipe carry it, a filter removes leaves and dirt, a tank stores it, a pump sends it to the garden and toilets.
The flow chart illustrates how a house collects and reuses rainwater in five stages. The process begins when rain falls on the roof. Gutters and a downpipe then carry the water down from the roof.
Next, a filter removes leaves and dirt before the water is stored in a tank. Finally, a pump sends the stored water to the garden and the toilets. This shows how a home can cut its use of mains water.
Sample 6: Coffee production (manufacturing)
Practice chart: six stages. Coffee cherries are picked, the beans are dried, hulled, roasted, ground, then packed and shipped.
The diagram shows how coffee is produced, from the farm to the packet, in six stages. First, ripe coffee cherries are picked by hand or by machine. The beans are then dried and hulled, which removes their outer layers.
After that, the green beans are roasted, which gives them their brown color and flavor. Next, they are ground, and finally the coffee is packed and shipped. The end product is coffee ready for sale.
Sample 7: Black tea production (manufacturing)
Practice chart: six stages. Tea leaves are plucked, withered, rolled, oxidized, dried, then sorted and packed.
The flow chart illustrates how black tea is produced in six stages. It starts on the tea estate and ends with packed tea. First, young leaves are plucked from the tea bushes. Next, they are withered so that they lose moisture and become soft.
After that, the leaves are rolled, which breaks their cells, and then they are left to oxidize and turn dark. Finally, they are dried, sorted and packed. Overall, the process turns fresh green leaves into tea ready for sale.
Sample 8: Bread making (manufacturing)
Practice chart: six stages. Ingredients are mixed into dough, the dough is kneaded, left to rise, shaped, baked in an oven, cooled and sliced.
The chart shows how bread is made in six stages. The process begins when flour, water, yeast and salt are mixed into a dough. Next, the dough is kneaded and then left to rise for some time.
After that, it is shaped into loaves and baked in a hot oven. Finally, the bread is cooled and sliced. Overall, the chart shows a short linear process that turns basic ingredients into a finished loaf.
Sample 9: Life cycle of a bean plant (life cycle)
Practice chart: five stages. Seed, germination with a root and shoot, seedling, flowering plant, pods with new seeds.
The diagram illustrates the life cycle of a bean plant in five stages. It begins with a seed in the soil. When the seed germinates, a root grows down and a shoot grows up.
Next, the shoot becomes a seedling with its first leaves. After that, the mature plant produces flowers. Finally, the flowers develop into pods that hold new seeds, so the cycle can begin again.
Sample 10: A company hiring process (business)
Practice chart: six stages. A vacancy is identified, the job is advertised, applications are screened, shortlisted candidates are interviewed, an offer is made, the new employee is onboarded.
The flow chart shows how a company hires a new employee, in six stages. It starts when the company identifies a vacancy. Next, the job is advertised and applications are collected.
After that, the applications are screened, and the shortlisted candidates are invited to interviews. Once the best candidate is chosen, the company makes a job offer. Finally, the new employee is onboarded, which completes the hiring process.
Sample 11: Household solar electricity (technical)
Practice chart: four stages and one branch. Roof panels turn sunlight into DC electricity, an inverter converts it to AC, the AC powers the home, and the grid supplies extra power when the panels produce too little.
The diagram shows how a house produces electricity with solar panels. First, panels on the roof capture sunlight and turn it into direct current, or DC. Next, an inverter converts this DC into alternating current, or AC.
After that, the AC electricity powers the lights and appliances in the home. However, when the panels produce too little, the house draws extra power from the grid. Overall, the system lowers the home's need for grid electricity.
Sample 12: An annual budget cycle (business)
Practice chart: six stages in a loop. Set goals, collect data, forecast income and costs, prepare the budget, monitor results, review and adjust, which feeds the next year's goals.
The chart illustrates a yearly budget cycle with six stages. It begins when a business sets its goals for the year. Next, it collects data and forecasts its income and costs.
After that, the budget is prepared. During the year, the results are monitored against the budget. Finally, the business reviews what happened and adjusts its plans. These lessons shape the next year's goals, so the cycle repeats.
How Do You Score High in a PTE Process Chart?
To score high, cover the start, the main stages and the end in order, keep moving forward at an even pace, and always state the outcome. One practice loop does most of the work: one process chart, a 25-second plan, a 40-second recording, then a review against the three traits.
Time the overview line first, then add stages until you can reach the outcome inside 40 seconds. Rotate varied charts, natural, manufacturing, life cycle and business, so no single type surprises you on test day.
How Does the Process Chart Fit Into Describe Image?
The process chart is one image type inside Describe Image, so every timing and scoring rule comes from that one task. Our PTE describe image page covers the task as a whole, including graphs, maps and pictures.
How Is a Line Graph Different From a Process Chart?
A line graph shows numbers changing over time, so the answer follows the trend; a process chart shows stages in order, so the answer follows the sequence. Pearson's "incorporate numbers" tip therefore drives a line graph answer but rarely a process answer. The PTE line graph page gives the trend method.
Which Process Chart Practice Questions Can You Try?
These practice process charts give you the stages only, so you plan and record your own 40-second answer before checking it against the three traits. Work through the practice questions in any order; each stage list runs in chart order. Once these feel easy, our map chart practice questions give you a different image type to plan in the same 25 seconds.
- Chocolate production: cocoa pods are harvested, the beans are fermented and dried, roasted, ground into a paste, mixed with sugar, and poured into molds.
- Cheese making: milk is heated, a culture and rennet are added, curds form, the curds are cut and the whey is drained, the curds are pressed into molds, and the cheese is aged.
- Silk production: a silkworm hatches, feeds on mulberry leaves, spins a cocoon, the cocoon is boiled, the thread is unwound, and the thread is woven into cloth.
- Honey production: bees collect nectar, fan it in the hive until it thickens into honey, and seal the cells with wax. The beekeeper then extracts, filters and jars the honey.
- Drinking water treatment: river water is pumped in, chemicals make small particles clump together, the clumps settle, the water is filtered, disinfected, stored, and piped to homes.
- Online order delivery: a customer places an order, payment is confirmed, the item is picked and packed in a warehouse, shipped, and delivered to the door.
- Life cycle of a mosquito: eggs are laid on water, larvae hatch, the larvae become pupae, and adult mosquitoes emerge and lay new eggs.
- Library book loan: a reader finds a book, borrows it at the desk, takes it home, returns it by the due date, and the book goes back on the shelf.
Does the 3-Second Rule Apply to a Process Chart?
Yes, Pearson states the 3-second rule in its Answer Short Question block and applies it to Describe Image. A silence of three seconds while speaking changes the recording status to completed, and you can't continue. Pearson adds, "This also applies to speaking item types Read aloud, Repeat Sentence, Describe Image and Re-tell Lecture."
The safe habit is to start right after the short tone and keep moving from stage to stage, even past a missed box. Our page on the 3-second rule in PTE speaking gives the full wording.
How Do You Improve Oral Fluency for Process Chart Answers?
Oral fluency on a process chart improves when you practice linking stages with sequence words at an even pace, without stopping to check the next box. Say "after that" and "next" aloud between stages until the link comes without thought, because Pearson's Oral Fluency trait penalizes hesitations, repetitions and false starts. Our guide to oral fluency in PTE adds drills.
How Do You Stay Calm When a Process Chart Looks Complex?
A busy chart feels harder than it is, because the answer only needs the start, three or four main stages and the end. You stay calm by planning the overview line first, so you always have a safe first sentence. If you freeze on a box, treat it as a missed stage: skip it and keep moving. For calming routines before and during the test, read our guide to PTE exam anxiety.
Practice PTE Speaking on EasyEnglish
Try Speaking tasks in a timed, computer-based format like the real test.
Try speaking practice without signing up. A free account is required for full mock tests. Practice scores are estimates, not official Pearson scores.
Written by
EasyEnglish Team
The team behind EasyEnglish's PTE practice and mock tests
EasyEnglish provides PTE practice and independent preparation guides. Official test rules are checked against the sources identified in each guide; practice examples are illustrative, not real exam questions. Practice scores are estimates. Questions or corrections: support@inverseai.com. EasyEnglish is not affiliated with or endorsed by Pearson.
Editorial review completed .