PTE Speaking Map Chart: Process, Template and Tips
PTE Speaking
A map has just filled your screen in PTE Speaking, and you have 25 seconds before the microphone opens. That map chart is the image in a Describe Image item: you study it, then you get 40 seconds to say where its key features sit, what changed and what the map suggests.
Pearson runs one Describe Image task and publishes no map-specific rules, so every rule below is Pearson's Describe Image rule applied to a map. Pearson's own PTE Academic tip example is itself a map, showing where gorilla subspecies live across Africa, and its speaking advice for a map is to ask, "what are the important features?"
Table of Contents
What Is a Map Chart in PTE Describe Image?
In PTE, a map chart is a map shown as the image in a Describe Image speaking item, picturing places, routes, areas or data spread across regions, sometimes at two points in time. You say what the map shows, its most important features and where they sit, and what the map suggests. Pearson describes one Describe Image task whose image "could be a graph, picture, map, chart or table", so a map sits among several image types under the same rules. PTE Academic and PTE Core both include Describe Image.
How Does the PTE Map Chart Task Work?
The map appears on screen, you have 25 seconds to study it, the microphone opens after a short tone, and you have 40 seconds to speak, recorded once. The table sets out the timing and rules for a single map item.
| Stage | Time or rule |
|---|---|
| Study the map | 25 seconds |
| Short tone | Microphone opens after it |
| Speak | 40 seconds |
| Finish | Before the progress bar ends |
| Recording | Once only |
| Notes | Erasable noteboard |
| Items per PTE Academic test | 5-6 Describe Image questions (Score Guide) |
Pearson's PTE Academic Test Taker Score Guide lists 5-6 Describe Image questions per test. It doesn't say how many of them are maps, because each image can be any of the kinds Pearson names, so plan for a map without counting on one.
What Types of Map Charts Appear in PTE?
For practice, maps sort into four kinds: place maps, change maps, route maps and data or thematic maps. Pearson names no map types, so this grouping is a study aid, and each kind tells you what to say first.
- Place map: a town, campus or floor plan, where you start with the location of the main features.
- Change map: one place before and after development, with or without years, where you start with what was added, removed or replaced, then what stayed the same.
- Route map: a path from one point to another, where you give the start, the turns and landmarks, and the end point.
- Thematic map: a data map with a color legend, shading or symbols, which you treat like a chart by naming the highest and lowest areas with their figures.
Pearson's own tip example is a distribution map of gorilla subspecies across regions of Africa, which shows that Pearson uses data maps in its own examples. If you've seen lists of "7 types of maps" from geography class, skip them; PTE doesn't score map classification.
How Do You Describe a Map in PTE?
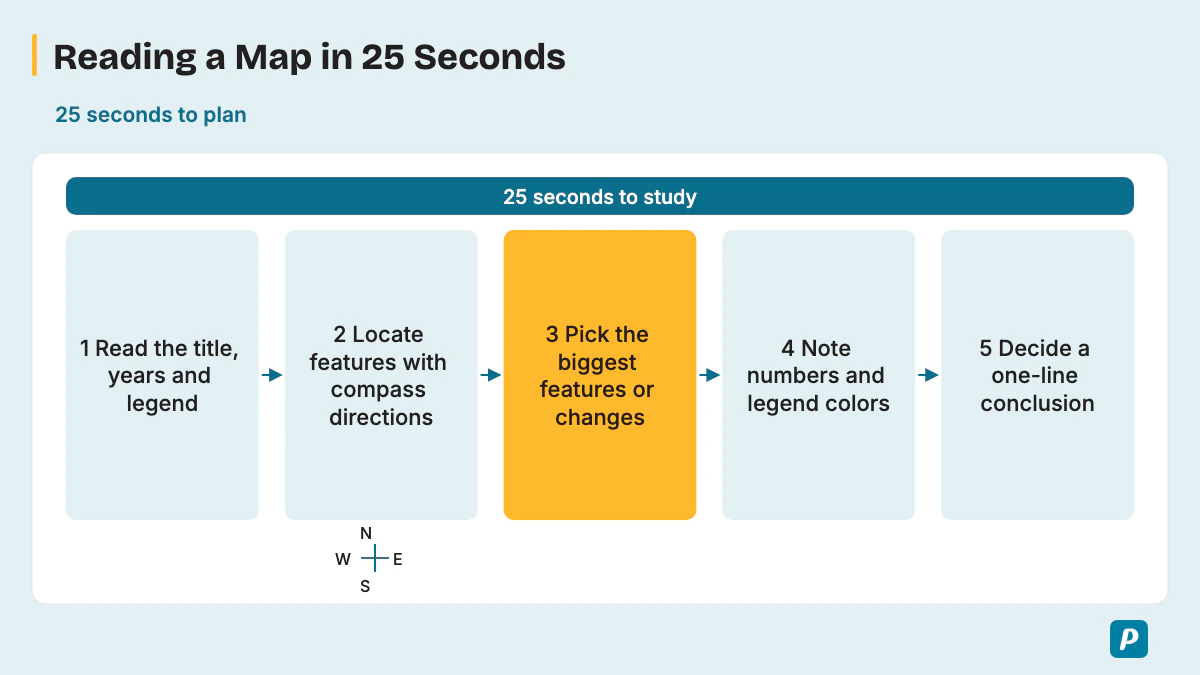
Read the title, find the two or three most important features and where they are, note any change or figures, and decide one line of conclusion before the tone. These five moves fit inside the 25 seconds of study time.
- Read the title, plus any years, legend or key.
- Locate the main features using compass directions.
- Pick the two or three prominent features or changes, since Pearson advises noting a map's important features.
- Jot the numbers or legend colors you will quote on the noteboard.
- Decide your one-line conclusion.
Pearson's Describe Image advice adds three limits: don't try to mention every feature, don't spend too long on labels, and avoid personal opinions. In Pearson's words, "Stick to describing the elements you can see in the image." Skip minor roads and small icons. Pearson also says to use numbers from the image, so on a data map say "just over 40 percent" or "the district shaded dark purple", never "a lot".
When two maps appear, compare them rather than describing each in turn. Say what changed, then name one or two features that stayed the same, because an unchanged river or road anchors the listener between the two maps.
The 40 seconds split roughly into four parts. This is a pacing habit for practice, not a Pearson rule; Pearson's own target is 30-40 seconds of speech.
| Part | Seconds | What you say |
|---|---|---|
| Name the map | About 5 | What place, data or years the map shows |
| Biggest feature or change | About 10 | The most important feature and where it is |
| Two more features | 15-20 | Locations, figures or what stayed the same |
| Conclusion | About 5 | What the map suggests overall |
How Is a Map Chart Response Scored?
A map answer is scored exactly like any Describe Image answer: Content, Pronunciation and Oral Fluency, with partial credit. Content rewards covering the main parts of the map, the relationships between them and a conclusion or implication. Pearson's Score Guide gives each trait its own scale.
| Trait | Score Guide scale | What it means for a map |
|---|---|---|
| Content | Academic: 0-6; Core: 0-5 | Cover the main features, how they relate in space or over time, and a conclusion. |
| Pronunciation | 0-5 | Say place names clearly, as best you can. |
| Oral Fluency | 0-5 | Keep a smooth, even pace while moving around the map. |
The Score Guide scores Content first, and a Content score of 0 means no further scoring for that item. It treats pre-prepared or memorized material as an irrelevant response. Level 1 Content is "a list of points identified on the image, without description or elaboration". At level 6, "A listener could build a complete mental picture of the image from the response."
In PTE Academic, AI scores all three traits and a human expert also reviews Content before the task score is confirmed. If the AI and the human disagree, a second human makes the final judgment, and Pronunciation and Oral Fluency stay AI-scored only. PTE Core's format page names the same three traits and partial credit but says nothing about human review.
Pearson's 2021 speaking article said Content was worth up to 5 points; the current Academic Score Guide gives Content 0-6, while Core uses 0-5. The same article has a useful tip for place names: if you aren't sure how to pronounce a word on the image, "just say them how you think they should be said."
Is There a Map Chart Template for PTE?
Not a fill-in map chart template: Pearson says memorized responses or templated sentences can lead to a score of 0 for Content, and then Fluency and Pronunciation aren't scored. A flexible three-part structure, taken from Pearson's own tip order, does the job safely.
- General content: say what place or data the map shows and, for two maps, which years.
- Main point: give the two or three biggest features or changes and where they are.
- Other details and conclusion: add one more feature and what the map suggests overall.
Some prep sites still publish fill-in map templates and say 30-35 seconds of speech is enough; Pearson's current advice is to avoid templated sentences and aim for 30-40 seconds. Treat the four-part timing table above as a pacing guide only. The places, directions and figures on this map, not a stock sentence, earn Content.
What Vocabulary Describes a Map Chart?
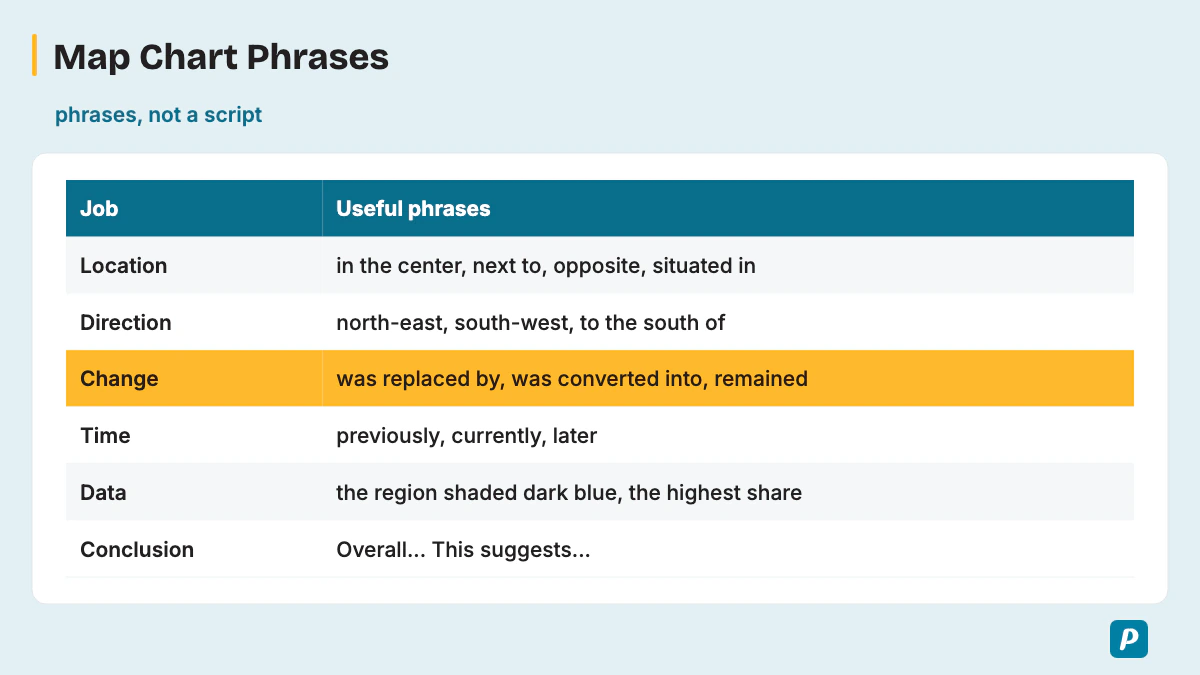
Map answers run on location words, direction words, change words for before-and-after maps, and data words for maps with a legend. The table groups each phrase by the job it does in your answer.
| Job | Useful phrases |
|---|---|
| Name the map | "The map shows...", "The two maps compare..." |
| Location | "in the center", "next to", "opposite", "situated in", "between", "along" |
| Direction | north, north-east, east, south-east, south, south-west, west, north-west; "to the south of" |
| Route | "leads to", "turn left at", "cross the bridge" |
| Change | "was replaced by", "was extended", "was demolished", "was converted into", "was renovated", "a new ... was built", "remained" |
| Time | "previously", "currently", "earlier", "later", "by 2020" |
| Data | "the region shaded dark blue", "the highest share", "below 10 percent" |
| Linking | "compared to", "in contrast", "over time" |
| Conclusion | "Overall...", "This suggests..." |
Reuse these phrases inside your own sentences; don't memorize a paragraph around them. A car park that "was replaced by" a park says more than one that "changed", and a library "situated in the west" tells the listener exactly where to look. Pearson's 2021 article also lists simple connectors such as "also", "however", "as" and "besides".
Two short verb sets round out the table.
- Description verbs: illustrates, shows, connects, surrounds, leads to, borders, runs through, stretches.
- Change verbs: expanded, converted, renovated, removed, transformed, relocated.
What Are Common Map Chart Mistakes?
The costly mistakes are reading out every street or icon, mixing up directions, stopping to search for a place name, and ending without a conclusion. Each one below costs a specific trait.
- Reading every label turns the answer into "a list of points", which is level 1 Content.
- Confusing north and south directions puts wrong locations into your Content.
- Saying "many people" where the legend gives a figure leaves Content vague.
- Describing two maps one after the other, without comparing them, hides the change Content rewards.
- Long pauses over a hard place name pull down Oral Fluency, and a 3-second silence ends the recording.
- A memorized opening that doesn't fit the map risks a score of 0 for Content.
- A personal opinion about the place breaks Pearson's advice to describe only what you can see.
- Speaking too fast blurs place names and costs Pronunciation, while speaking too slowly runs out the clock; Pearson asks for "a smooth, natural speed".
- No conclusion or implication leaves Content short of its top level.
What Does a Map Chart Sample Answer Look Like?
A sample answer names the place and years, gives the two or three biggest features or changes with their location, then adds one detail and a conclusion, in about 30-40 seconds. All 12 practice maps below are illustrative, not real data, and both the maps and the answers are original practice material, not real exam questions. Watch how the change words, such as "was replaced by" and "remained", carry the before-and-after samples.
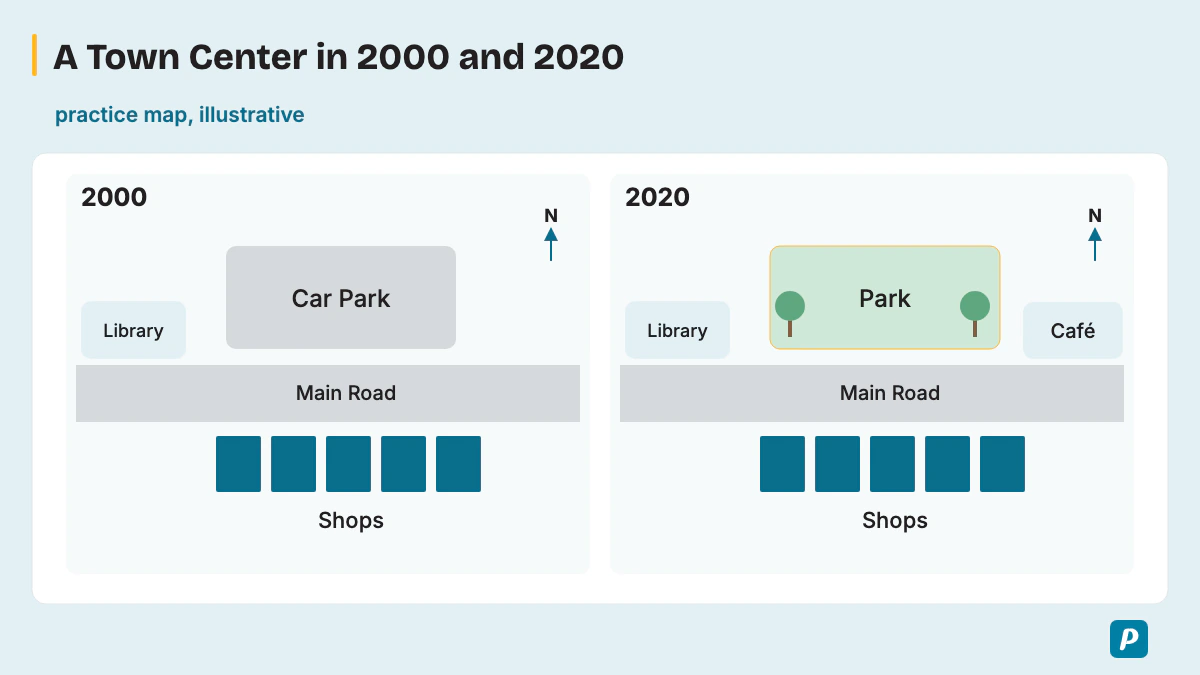
Sample 1: A town center in 2000 and 2020 (change map, annotated)
Practice map (illustrative, not real data): two maps of a small town center. In both years a main road runs east to west through the middle, a row of shops lines the south side of the road, and a library stands at the western end. In 2000 a car park sits north of the road. By 2020 the car park has been replaced by a park, and a new café has been built at the eastern end of the road.
[General content] The two maps compare a small town center in 2000 and 2020. [Main point] The biggest change is north of the main road, where the car park was replaced by a park. The main road still runs from east to west through the middle, and the row of shops on the south side remained, as did the library at the western end.
[Other details and conclusion] In addition, a new café was built at the eastern end of the road by 2020. Overall, the town center became greener while its main services stayed in place.
In the annotated answer, the first sentence is General content. The Main point gives the biggest change with its location, then names what stayed the same, which is the comparison that change maps need. The last part adds the café as its detail and closes with what the map suggests.
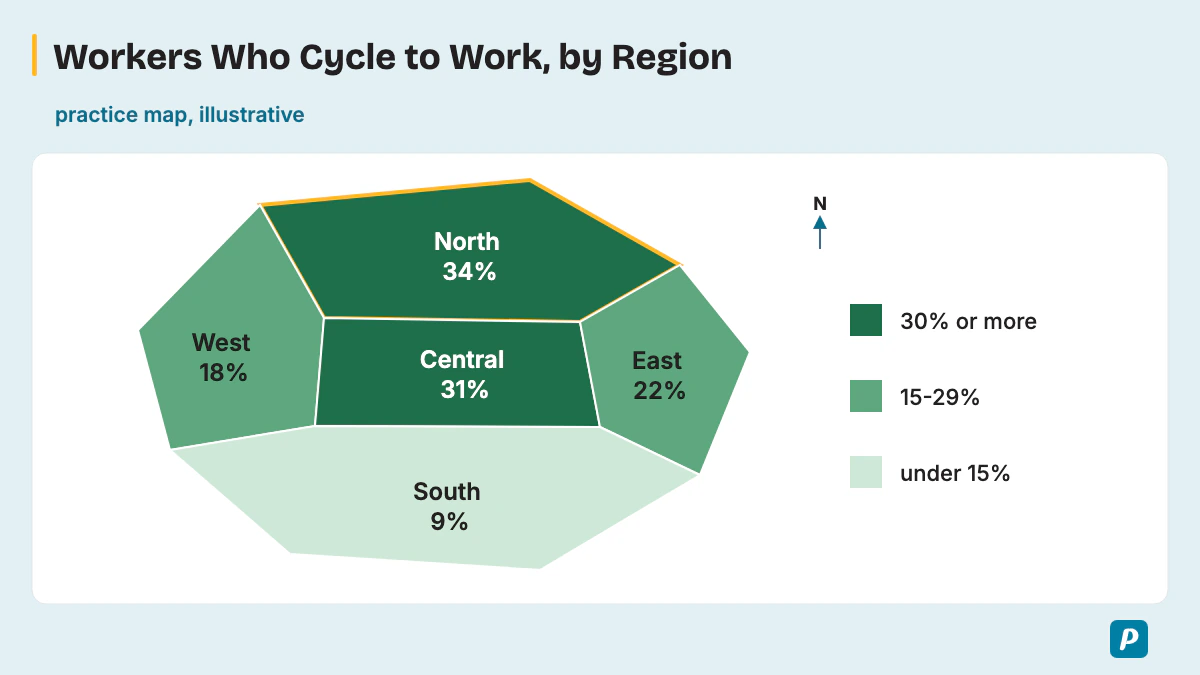
Sample 2: Cycling to work by region (data map, annotated)
Practice map (illustrative, not real data): a fictional country with five regions, shaded by the share of workers who cycle to work. The legend shows dark green for 30 percent or more, mid green for 15-29 percent and light green for under 15 percent. North 34 percent (dark green), Central 31 percent (dark green), East 22 percent (mid green), West 18 percent (mid green), South 9 percent (light green).
[General content] The map shows the share of workers who cycle to work in the five regions of a country, with darker green meaning a higher share. [Main point] The North has the highest share at 34 percent, followed closely by the Central region at 31 percent. The East and the West sit in the mid green group, at 22 and 18 percent.
[Other details and conclusion] In contrast, the South, shaded light green, has the lowest share at just 9 percent. Overall, cycling to work is most common in the north and center and least common in the south.
The data sample works like a chart answer laid on a map. The Main point quotes the two highest figures with their regions and colors, and the detail gives the lowest, so the listener hears the full range from 34 to 9 percent before the conclusion.
Sample 3: An old factory site before and after redevelopment (change map)
Practice map: a riverside site shown before and after. Before, a large factory covers the center, a storage yard lies to its east, a railway line runs along the northern edge and a river runs along the southern edge. After, apartment blocks replace the factory, a supermarket replaces the storage yard, a green space with a footpath runs along the river, and the railway line remains.
The two maps show how an old factory site was redeveloped. The biggest change is in the center, where the factory was replaced by apartment blocks. To the east, the storage yard was converted into a supermarket. Along the southern edge, a new green space with a footpath now follows the river, while the railway line on the northern edge remained. Overall, the site changed from industry to homes, shopping and leisure.
Sample 4: A coastal village in 1960, 1990 and 2020 (change map, three years)
Practice map: three maps of a village. In 1960 a fishing harbor sits in the south, about twenty houses line one road running north from it, and farmland covers the east and west. By 1990 houses have spread along a new road to the west, and a school has been built north of the village. By 2020 the harbor is a marina for leisure boats, a hotel stands on the eastern farmland, and houses cover most of the western farmland.
The three maps show how a coastal village developed between 1960 and 2020. In 1960 it was a small fishing village, with about twenty houses along one road leading north from the harbor. By 1990 houses had spread west along a new road, and a school had been built to the north. By 2020 the harbor had been converted into a marina, and a hotel had been built on the eastern farmland. Overall, the village grew steadily and turned from fishing to tourism.
Sample 5: A university campus (place map)
Practice map: a campus with the library at the center and lecture halls just north of it. A sports hall stands in the north-west and student housing in the east. A lake lies in the west, and the main car park is in the south next to the entrance.
The map shows the layout of a university campus. The library is situated at the center, with the lecture halls directly to its north. In the north-west there is a sports hall, while student housing fills the eastern side. A lake lies in the west, and the main car park is in the south, next to the entrance. Overall, the teaching buildings sit in the middle, with sport, housing and parking around the edges.
Sample 6: A community center ground floor (floor plan)
Practice map: the main entrance sits in the middle of the south wall and opens into reception, with a lift beside reception. A café fills the south-east corner, a large hall runs along the whole north side, and the toilets are in the west next to a small meeting room.
The floor plan shows the ground floor of a community center. Visitors enter through the main entrance in the middle of the south wall, which opens into reception, with a lift beside it. The café is in the south-east corner, and a large hall runs along the entire north side. In the west, the toilets are next to a small meeting room. Overall, reception and the café are near the southern entrance, while the hall occupies the north side.
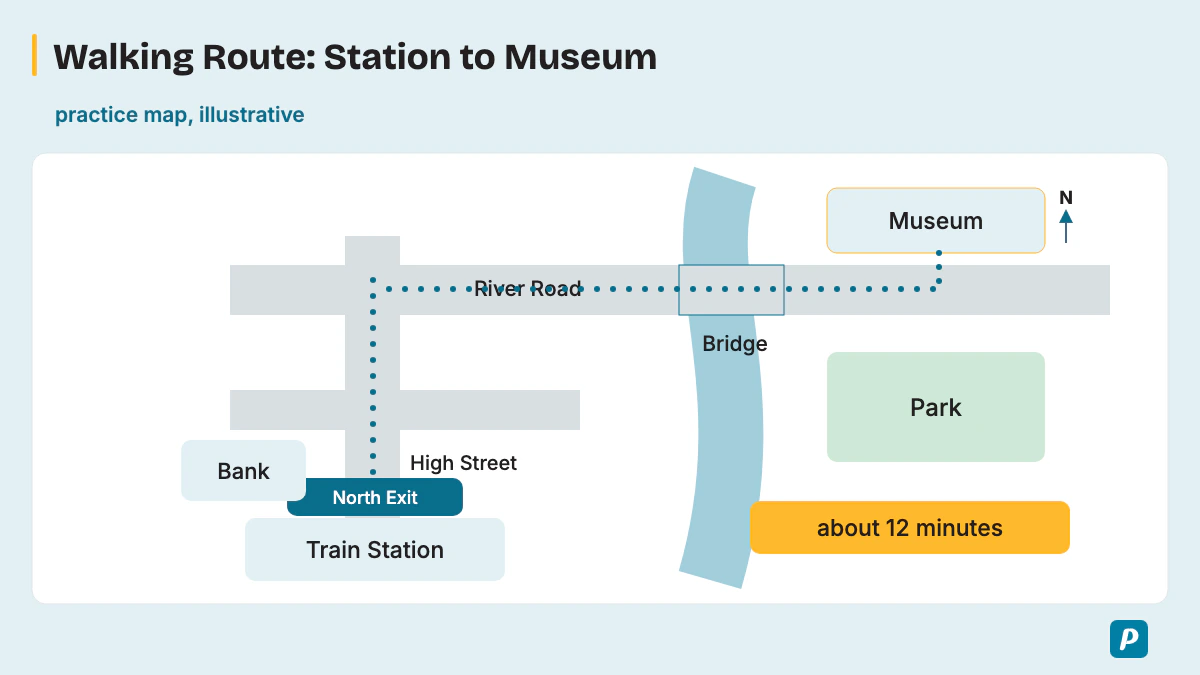
Sample 7: From a train station to a museum (route map)
Practice map: a walking route marked as about 12 minutes. It starts at the north exit of the station and goes north along High Street, past a bank on the left. It turns right at the second junction onto River Road, crosses a bridge over the river, and ends at the museum on the left, opposite a park.
The map shows a walking route from a train station to a museum, which takes about 12 minutes. The route starts at the station's north exit and goes north along High Street, passing a bank on the left. At the second junction, it turns right onto River Road and then crosses a bridge over the river. The museum is on the left, opposite a park. Overall, it is a short, direct walk with one main turn.
Sample 8: An airport rail link (route map)
Practice map: a rail line runs from the airport in the west to the city center in the east, with three stops in between: Business Park, University and Stadium. The journey takes 25 minutes, and a motorway runs parallel to the line on its southern side.
The map shows a rail link between an airport and a city center. The line starts at the airport in the west and runs east to the city center, taking 25 minutes in total. Along the way, trains stop at three stations: Business Park, University and Stadium. A motorway runs alongside the line to the south. Overall, the rail link connects the airport with three stops and the city center in 25 minutes.
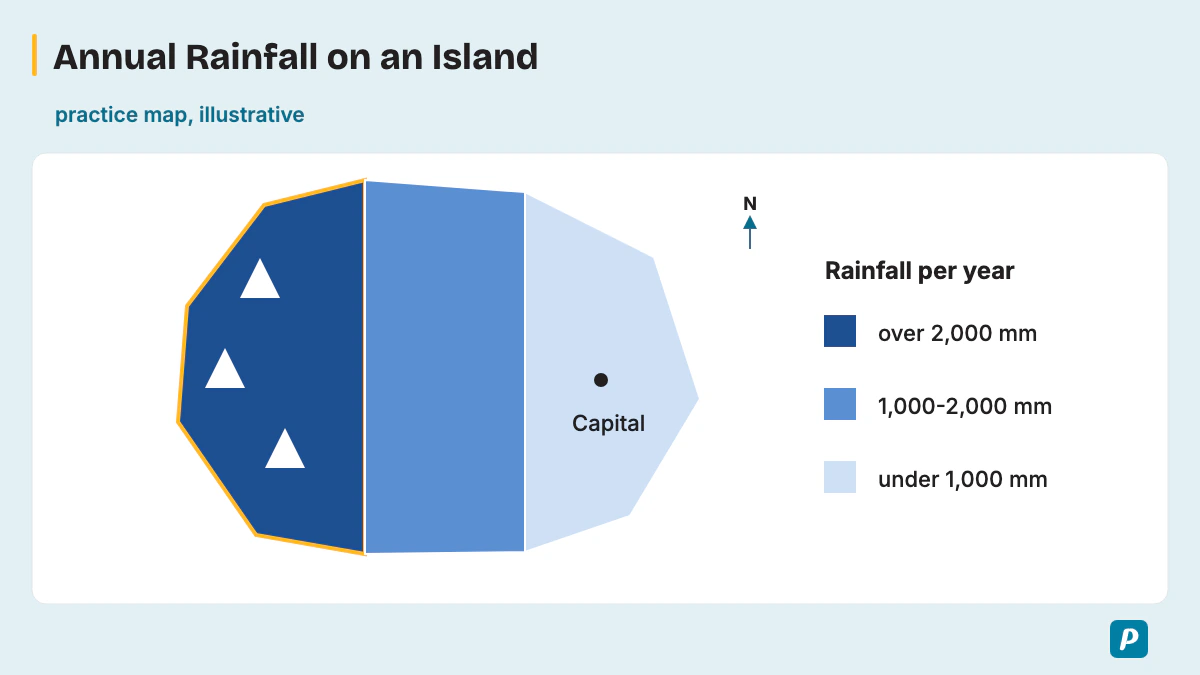
Sample 9: Annual rainfall on an island (data map)
Practice map: a fictional island shaded by yearly rainfall. Dark blue shows over 2,000 mm, mid blue shows 1,000-2,000 mm and pale blue shows under 1,000 mm. Mountains along the west coast are dark blue, the center is mid blue, and the east coast, where the capital city sits, is pale blue.
The map shows how much rain falls each year across an island, using three shades of blue. The wettest area is the mountainous west coast, shaded dark blue, which receives over 2,000 millimeters a year. The center of the island is mid blue, with 1,000 to 2,000 millimeters. In contrast, the east coast, where the capital is located, is pale blue and gets under 1,000 millimeters. Overall, the island gets drier from west to east.
Sample 10: Population density (data map)
Practice map: a fictional country shaded by people per square kilometer. Dark red shows more than 300, orange shows 50-300 and yellow shows under 50. The east coast around two port cities is dark red, the central plains are orange, and the western desert, the largest area, is yellow.
The map shows population density across a country, measured in people per square kilometer. The highest density, more than 300 people, is found on the east coast around two port cities, shaded dark red. The central plains are orange, with between 50 and 300 people. The western desert, which covers the largest area, is yellow, with fewer than 50 people per square kilometer. Overall, the eastern coastal areas have the highest population density, while the western desert has the lowest.
Sample 11: Hospitals and clinics in a county (distribution map)
Practice map: a fictional county with red crosses for hospitals and blue dots for clinics. There are 4 hospitals and 9 clinics. The city in the east has 3 hospitals and 5 clinics. The hilly west has 1 hospital and 4 clinics spread along its one main road.
The map shows where hospitals and clinics are located in a county, with red crosses for hospitals and blue dots for clinics. Of the 4 hospitals, 3 are in the city in the east, along with 5 of the 9 clinics. The hilly west has only 1 hospital, and its 4 clinics are spread along a single main road. Overall, health services are concentrated in the eastern city, so people in the west have fewer options nearby.
Sample 12: A city metro network (transport map)
Practice map: three metro lines. The red line runs north to south and ends at the port in the south. The blue line runs east to west and ends at the airport in the east. The green line is a loop of eight stations around the center. All three lines meet at Central station.
The map shows a city metro network with three lines. The red line runs from north to south and ends at the port, while the blue line crosses the city from west to east and ends at the airport. The green line forms a loop of eight stations around the center. All three lines meet at Central station. Overall, Central is the main interchange, and the network links the city to both its port and its airport.
How Do You Score High in a PTE Map Chart?
To score high, name the most important features and where they are, keep a smooth pace through place names, and always close with what the map suggests. One practice loop does most of the work: one map, a 25-second plan, a 40-second recording, then a review against the three traits.
Rotate the four map kinds, place, change, route and data, so no single kind surprises you on test day. Time your first sentence and your conclusion, then add features until you can say the conclusion with five seconds to spare.
How Does the Map Chart Fit Into Describe Image?
The map chart is one image type inside Describe Image, so every timing and scoring rule comes from that one task. Our PTE describe image guide covers the task as a whole, including graphs, tables and pictures.
How Is a Process Chart Different From a Map Chart?
A process chart (or flow chart) shows stages in order, so the answer follows the sequence; a map shows places, so the answer follows location and change. A route map sits between the two, because it has a sequence of turns tied to places. The PTE process chart page gives the step-by-step method.
How Do You Practice Map Chart Samples?
Map practice works best on varied maps, place, change, route and data maps, each recorded once under real timing: 25 seconds to plan and 40 to speak. Replay each recording and check it against Content, Pronunciation and Oral Fluency before you try the next map chart samples. The benefits of online PTE practice include recorded practice with timers you don't have to run yourself.
Which Map Chart Practice Questions Can You Try?
These practice questions give each map in words only, so you plan and record your own 40-second answer before checking it against the three traits. Draw each of these practice maps as a quick sketch if it helps you see the layout, then speak from the sketch.
- A zoo layout: the entrance in the south, big cats in the north-east, a children's farm in the west, a lake with birds in the center, and a café beside the entrance.
- An airport terminal floor plan: check-in desks along the east side, security in the center, shops and restaurants after security, and departure gates 1-10 along the west side.
- A farming village in 1980 and 2020: fields, a mill and ten farms in 1980; by 2020 half the fields became houses, the mill became a museum and a supermarket opened by the main road.
- A city park before and after redevelopment: before, a grass field and a small pond. After, a playground in the north, a larger pond with a bridge, a running track and a café in the south.
- A ferry route between three islands: ferries leave the mainland port, reach North Island in 30 minutes, continue to East Island in 20 minutes, then sail on to South Island and return to the mainland.
- A shopping mall ground floor: a department store across the west end, a food court in the center, small shops along both sides, and car park entrances in the north-east and south-east.
- Internet access by district: a fictional city with four districts; the Central district 92 percent, the North 85 percent, the East 71 percent and the rural South 48 percent.
- A hiking trail map: the trail starts at a car park, climbs past a waterfall to a viewpoint at the summit, then returns along a lake shore to the car park.
Does the 3-Second Rule Apply to a Map Chart?
Yes, Pearson states the 3-second rule in its Answer Short Question block and adds that it also applies to Describe Image. Pearson writes, "If you stop for three seconds whilst speaking, the recording status will change to 'completed'", and you can't continue. It then adds, "This also applies to speaking item types Read aloud, Repeat Sentence, Describe Image and Re-tell Lecture."
Pearson's rule therefore ends any map answer that stalls on a hard name. The safe habit is to start right after the tone and move on to the next feature when a place name won't come. Our page on the 3-second rule in PTE speaking gives the full wording.
How Do You Improve Oral Fluency for Map Answers?
Oral fluency on a map improves when you practice moving between places with direction phrases at an even pace, without stopping on hard names. Say unfamiliar place names aloud a few times before you record, and link features with "to the north of" or "next to" until the phrase comes without thought. Our guide to oral fluency in PTE adds drills.
What If You Don't Understand the Map?
Start with what you can see, the title, the biggest shape or the darkest region, and keep talking, because a partial description can still earn Content while silence earns nothing. If a label is unreadable, describe the feature by its position instead, such as "the building in the north-east". Plan your first sentence from the title during the 25 seconds, so you always have a safe start and can stay calm.
For calming routines before and during the test, read our guide to PTE exam anxiety.
Practice PTE Speaking on EasyEnglish
Try Speaking tasks in a timed, computer-based format like the real test.
Try speaking practice without signing up. A free account is required for full mock tests. Practice scores are estimates, not official Pearson scores.
Written by
EasyEnglish Team
The team behind EasyEnglish's PTE practice and mock tests
EasyEnglish provides PTE practice and independent preparation guides. Official test rules are checked against the sources identified in each guide; practice examples are illustrative, not real exam questions. Practice scores are estimates. Questions or corrections: support@inverseai.com. EasyEnglish is not affiliated with or endorsed by Pearson.
Editorial review completed .