PTE Speaking Bar Graph: Process, Template and Tips
PTE Speaking
A bar graph on the PTE Speaking screen asks for one thing above all: comparison. You get 25 seconds to find the tallest bar, the shortest bar and the biggest gap, then 40 seconds to say what they show and what they add up to. The bar graph arrives as the image in a Describe Image item, so Pearson's Describe Image rules decide your timing and your score.
Pearson runs one Describe Image task and publishes no bar-graph-specific rules. The method below applies Pearson's own advice to bar graphs: say what the graph compares, give the key figures, then end with a conclusion drawn from the data. Twelve worked answers follow, starting with Pearson's own sample graph.
Table of Contents
What Is a Bar Graph in PTE Describe Image?
In PTE, a bar graph is one of the image types Describe Image can show, where bars of different lengths compare values across categories or across time. You describe the biggest and smallest bars, the main comparisons and what they suggest, under the same rules as every Describe Image item.
Bar graphs come in vertical, horizontal, grouped, stacked and bar-plus-line combination forms, and the analysis section below shows how to read each one. Bars can compare categories, such as countries, or track one measure across years. Pearson describes one Describe Image task and doesn't name bar graphs as a separate task. PTE Academic and PTE Core both include Describe Image.
What Is the Format of a Bar Graph Describe Image Question?
The bar graph appears on screen, you have 25 seconds to study it, the microphone opens after a short tone, and you have 40 seconds to speak, with one recording only. Each stage has a fixed time or rule.
| Stage | Time or rule |
|---|---|
| Study the graph | 25 seconds |
| Short tone | Microphone opens; speech before it isn't recorded |
| Speak | 40 seconds |
| Finish | Before the progress bar ends |
| Recording | One recording, once only |
Pearson's Score Guides list 5-6 Describe Image items in PTE Academic and 3-4 in PTE Core, but no Pearson page says which chart types those items use. The Core page's sample is a graph of New Zealand exports, and the Academic page's sample is a map of Africa showing gorilla distribution. So prepare for bar graphs as one image type among several, not as a fixed number of questions.
How Do You Analyze a Bar Graph in 25 Seconds?
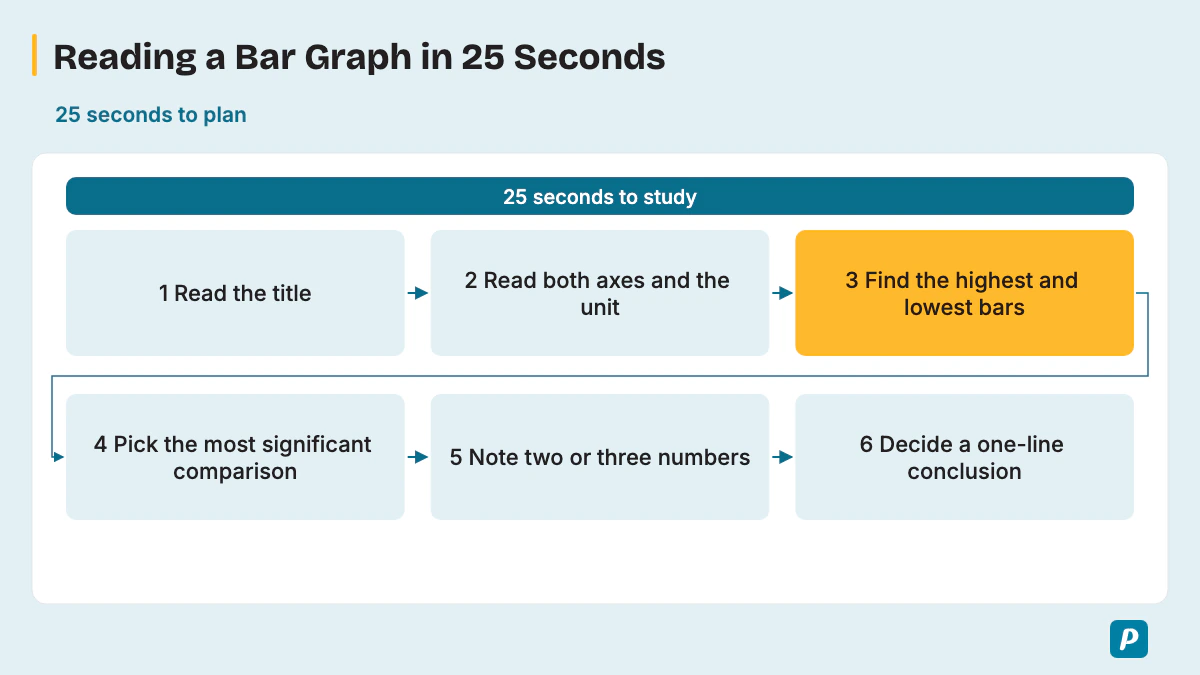
Read the title and both axes, find the highest and lowest bars, spot one clear comparison, and note two or three figures to say. Six short steps fit inside the prep time.
- Read the title to learn what is measured, where and when.
- Read the x-axis and y-axis, including the unit, such as percent or thousands.
- Find the highest bar and the lowest bar.
- Pick the most significant comparison or gap, as Pearson advises.
- Note two or three numbers on the noteboard in shorthand, such as "Aus 21" or "USA 14".
- Decide your one-line conclusion before the tone.
Pearson also advises against spending too long on labels. Look at what the bars show, not at every category name.
The variant changes what you check first. Use this table to adjust step 3 and step 4 for each kind of bar graph.
| Variant | What to check first | What to say |
|---|---|---|
| Vertical bars | Categories along the x-axis, values up the y-axis | Highest, lowest, biggest gap |
| Horizontal bars | Categories on the y-axis, values along the bottom | Same as vertical; the longest bar leads |
| Grouped (clustered) bars | The legend and colors | Compare inside each group, then across groups |
| Stacked bars | The total height of each bar | The tallest total, then the largest segment |
| Bar plus line | Both axes and the legend | Describe the bars, then the line, then link them |
| Bars over time | The first and last years | Start, end, peak, low and the overall trend |
When a value sits between two gridlines, estimate it with a word such as "just over" or "roughly" rather than guessing an exact figure. Pearson asks you to use numbers from the image, and an honest estimate still counts as a number.
How Is a Bar Graph Response Scored?
A bar graph answer is scored exactly like any Describe Image answer: Content, Pronunciation and Oral Fluency, with partial credit. Content rewards covering all the main parts of the graph, the relationships between bars and a conclusion or implication. Each trait has a bar-graph meaning.
| Trait | Pearson's definition | What it means for a bar graph |
|---|---|---|
| Content | All aspects of the image, plus relationships, possible developments and conclusions | Cover the main bars, the comparisons and a conclusion. |
| Pronunciation | Speech easily understood by most regular speakers, with correct word stress | Say numbers and category names clearly. |
| Oral Fluency | Smooth rhythm and phrasing at a constant, natural rate | Keep an even pace through the figures, with no restarts. |
Pearson's PTE Academic page says all three traits are AI-scored, and a human expert also reviews Content before your task score is confirmed. Hesitations, repetitions and false starts lower the Oral Fluency score.
Pearson's PTE Academic Score Guide scores Content from 0 to 6 and Pronunciation and Oral Fluency from 0 to 5 each, and counts Describe Image toward Speaking only; the PTE Core Score Guide scores Content from 0 to 5. At the top Academic Content level, the answer describes the image fully and expands on the relationships between features, so a listener could build a complete mental picture. At level 1, the answer is only a list of points from the image without description, which is exactly what reading out bars produces.
Is There a Bar Graph Template for PTE?
Not a fill-in bar graph template: Pearson says memorized responses or templated sentences can lead to a score of 0 for Content, and then Fluency and Pronunciation aren't scored either. Pearson's PTE Academic page also gives no credit for an unoriginal response and tells you to use your own words. Use a flexible three-part structure instead, built from Pearson's own order.
- General content: say what the graph compares.
- Main point: name the highest and lowest bars and the biggest gap, with figures.
- Other details and conclusion: add one more comparison and what it suggests.
Keep the conclusion tied to the bars. Pearson says to avoid personal opinions and stick to the elements you can see, and its own sample ends with a dependency statement drawn from the figures. Some prep sites still quote fixed slots such as 0-5, 5-30 and 30-40 seconds; Pearson's current page gives only the 40 seconds and the three-part order. Treat those slots as a rough pacing guide at most.
What Phrases and Vocabulary Help Describe a Bar Graph?
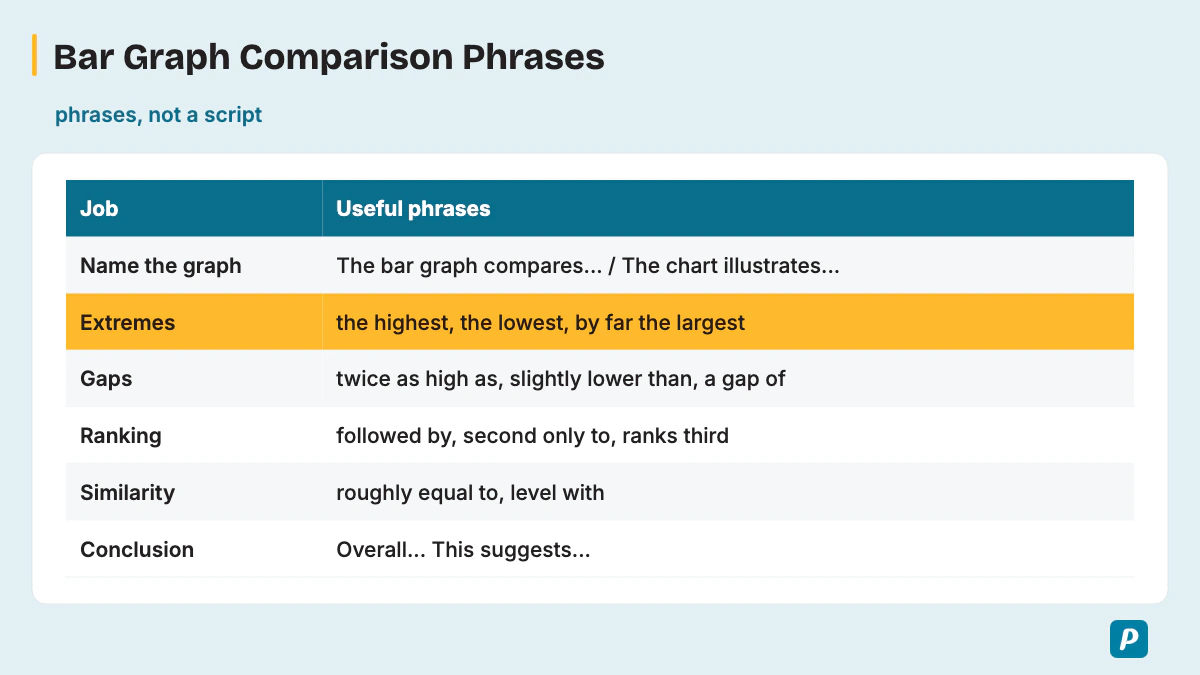
Comparison language does most of the work: superlatives for the extremes, comparatives for gaps and ranking words for the order of bars. Bars over time also need trend verbs, and every answer gets clearer with quantifiers, approximation words and linking words. Four short tables cover those jobs, with more than 70 phrases in all.
| Job | Useful phrases |
|---|---|
| Name the graph | "The bar graph compares...", "The chart illustrates...", "The graph shows..." |
| Extremes (superlatives) | "the highest", "the lowest", "by far the largest", "the smallest share" |
| Gaps (comparatives) | "twice as high as", "three times as many as", "slightly lower than", "a gap of" |
| Ranking words | "followed by", "second only to", "ranks third", "comes last" |
| Similarity | "roughly equal to", "level with", "similar to", "almost evenly split" |
| Conclusion | "Overall,...", "This suggests...", "Taken together,..." |
Trend verbs matter whenever the x-axis shows years or months. Each row gives the verbs and one example sentence.
| Trend | Verbs | Example sentence |
|---|---|---|
| Rise | rose, grew, climbed, increased, surged, doubled | "Online orders climbed from 12,000 in 2019 to 41,000 in 2024." |
| Fall | fell, declined, dropped, decreased, plummeted | "Newspaper sales fell from 50,000 to 28,000 copies." |
| No change | remained steady, leveled off, stayed the same, stabilized | "Sales remained steady at about 30,000 for two years." |
| Fluctuation | fluctuated, varied, rose and fell | "Visitor numbers fluctuated between 9,000 and 25,000." |
| Peak and low | peaked at, reached a high of, hit a low of, bottomed out at | "Visits peaked at 25,000 in July." |
| Speed of change | sharply, steadily, gradually, slightly, significantly | "Rainfall rose sharply between April and June." |
Quantifiers describe shares without a number, and approximation words handle bars that end between gridlines.
| Type | Phrases |
|---|---|
| Quantifiers | the majority, a minority, a significant number, a small proportion, nearly half, about a quarter, almost two-thirds |
| Approximation | just over, just under, roughly, approximately, around, close to, nearly |
Linking words show how two facts relate, so pick each one for its job.
| Linking words | Use them when | Example |
|---|---|---|
| in contrast, whereas | two bars or trends go opposite ways | "Tickets fell, whereas subscriptions rose." |
| similarly, likewise | two bars follow the same pattern | "Biography is low; similarly, science sits at 12,000." |
| however, but | you point out an exception | "Laundry stays at 30 to 40 liters in two towns, but Town B uses 50." |
| also, in addition | you add a related point | "Tea is second; in addition, juice sells just under 200." |
| overall, taken together | you sum up | "Overall, cars and trains carry 69% of staff." |
Reuse these phrases inside your own sentences rather than memorizing a paragraph. Pick a different set for each practice graph, and the answers stay original. Match the tense to the data: past tense for past years ("orders rose"), present tense for undated or current figures ("coffee leads").
What Does a Bar Graph Sample Answer Look Like?
A sample answer names what the graph compares, gives the largest values with their figures, then adds one detail and a conclusion drawn from the data, in about 30-40 seconds. The first one uses Pearson's own PTE Core sample graph of the main countries New Zealand exports goods to. Pearson calls it "the graph" and doesn't name the chart type, so treat it as practice for comparing bars.
Sample 1: New Zealand exports (Pearson's PTE Core sample)
| Destination | Share of New Zealand exports |
|---|---|
| Australia | 21% |
| USA | 14% |
| Japan | 11% |
| China | 6% |
| UK | 5% |
| Other countries | 43% |
The graph compares the main countries that New Zealand exports goods to. Australia is the largest single market, taking 21% of exports, followed by the USA at 14% and Japan at 11%. China and the UK receive much smaller shares, at 6% and 5%. All other countries together take 43%. Overall, Australia is New Zealand's most important single destination, with one and a half times the share of the USA.
In the annotated answer, the first sentence is General content. The second and third sentences are the Main point, using "the largest" and "followed by" to rank the figures. The last two sentences give Other details and the conclusion, and every claim comes from Pearson's own figures.
The 11 practice graphs below use made-up data written for practice, not real statistics. Each one covers a different bar graph variant, and each model answer uses only the figures in its own table.
Practice graph 2: audiobook downloads by genre on one app in one year (vertical bars, thousands)
| Fiction | Children's | Biography | Science | Travel |
|---|---|---|---|---|
| 48 | 36 | 15 | 12 | 9 |
The bar graph compares audiobook downloads in five genres on one app over one year. Fiction is by far the most downloaded genre at 48,000 downloads, followed by children's books at 36,000. Biography and science are much lower, at 15,000 and 12,000, while travel has the fewest downloads at only 9,000. Overall, fiction and children's books together account for 84,000 of the 120,000 downloads, or 70% of the total.
Practice graph 3: how staff at one company travel to work (horizontal bars, %)
| Car | Train | Bus | Bicycle | Walking |
|---|---|---|---|---|
| 42 | 27 | 14 | 10 | 7 |
The horizontal bar graph shows how employees at one company travel to work. Driving is the most common choice at 42%, followed by the train at 27%. The bus accounts for 14%, while cycling and walking are the least popular, at 10% and 7%. Overall, cars and trains together carry 69% of staff, more than two-thirds, whereas only 17% of employees cycle or walk.
Practice graph 4: college enrollments by course and gender, 2024 (grouped bar graph)
| Course | Men | Women |
|---|---|---|
| Engineering | 320 | 140 |
| Nursing | 60 | 310 |
| Business | 250 | 240 |
| Arts | 110 | 190 |
The grouped bar graph compares the number of men and women enrolled in four college courses in 2024. Engineering had 320 men, more than twice the 140 women. Nursing showed the reverse, with 310 women and only 60 men. Business was almost evenly split, at 250 men and 240 women, while arts attracted more women, at 190, than men, at 110. Overall, the gender balance changed sharply from one course to another.
Practice graph 5: daily water use per household in three towns, liters (stacked bar graph)
| Town | Bathing | Laundry | Cooking | Total |
|---|---|---|---|---|
| Town A | 90 | 40 | 20 | 150 |
| Town B | 70 | 50 | 20 | 140 |
| Town C | 110 | 30 | 25 | 165 |
The stacked bar graph shows daily water use per household in three towns, split into bathing, laundry and cooking. Town C uses the most in total, at 165 liters, followed by Town A at 150 and Town B at 140. Bathing is the largest segment in every town and peaks at 110 liters in Town C. Laundry is highest in Town B, at 50 liters. Overall, the towns differ most in bathing, which ranges from 70 to 110 liters.
Practice graph 6: monthly rainfall and average temperature in one city (bar plus line)
| Month | Jan | Feb | Mar | Apr | May | Jun |
|---|---|---|---|---|---|---|
| Rainfall, mm (bars) | 20 | 35 | 60 | 95 | 140 | 180 |
| Temperature, °C (line) | 31 | 29 | 27 | 24 | 22 | 21 |
The combination chart shows monthly rainfall as bars and average temperature as a line for one city from January to June. Rainfall rises every month, from just 20 millimeters in January to 180 millimeters in June, nine times as much. Over the same months, the temperature falls steadily from 31 degrees to 21 degrees. Overall, the wettest months are also the coolest, so rainfall and temperature move in opposite directions.
Practice graph 7: online orders at one store, thousands (bars over time, rise)
| 2019 | 2020 | 2021 | 2022 | 2023 | 2024 |
|---|---|---|---|---|---|
| 12 | 15 | 21 | 28 | 34 | 41 |
The bar graph shows online orders at a store from 2019 to 2024, in thousands. Orders rose every year, starting at 12,000 in 2019 and climbing to 21,000 by 2021. Growth continued to 34,000 in 2023 and peaked at 41,000 in 2024. The largest yearly gains, 7,000 orders each, came in 2022 and 2024. Overall, online orders more than tripled across the six years.
Practice graph 8: daily print newspaper sales in one town, thousands (bars over time, fall)
| 2018 | 2019 | 2020 | 2021 | 2022 | 2023 |
|---|---|---|---|---|---|
| 50 | 46 | 39 | 33 | 30 | 28 |
The bar graph shows daily sales of print newspapers in a town from 2018 to 2023. Sales fell in every year, from 50,000 copies in 2018 to 28,000 in 2023. The sharpest drop came in 2020, when sales declined by 7,000 to 39,000. After that, the fall slowed, with only 2,000 copies lost between 2022 and 2023. Overall, daily sales dropped by 44% over the six years.
Practice graph 9: monthly museum visitors, thousands (bars over time, fluctuation)
| Jan | Feb | Mar | Apr | May | Jun | Jul | Aug |
|---|---|---|---|---|---|---|---|
| 14 | 9 | 17 | 12 | 22 | 16 | 25 | 19 |
The bar graph shows monthly visitors to a museum from January to August, in thousands. Numbers fluctuate from month to month, but the overall direction is upward. February is the lowest month, with 9,000 visitors, while July is the peak at 25,000. Each rise is followed by a smaller fall, for example from 22,000 in May to 16,000 in June. Overall, the museum ends with 19,000 visitors in August, up from 14,000 in January.
Practice graph 10: favorite way to learn new vocabulary, 500 learners surveyed (%)
| Flashcard apps | Reading | Videos | Word lists | Other |
|---|---|---|---|---|
| 38 | 26 | 21 | 10 | 5 |
The bar graph shows the favorite ways to learn new vocabulary among 500 surveyed learners. Flashcard apps are the most popular method, chosen by 38%, or 190 learners. Reading comes second at 26%, followed by videos at 21%. Word lists are far less popular at 10%, and only 5% choose another method. Overall, flashcard apps and reading together account for almost two-thirds of learners, at 64%.
Practice graph 11: weekly drink sales at a café (gridlines every 100, values read by eye)
| Coffee | Tea | Juice | Smoothies | Water |
|---|---|---|---|---|
| about 420 | about 250 | about 190 | about 150 | about 100 |
The bar graph shows weekly drink sales at a café. Coffee is the clear leader, selling just over 400 cups a week. Tea comes second at roughly 250, while juice sells just under 200. Smoothies sell around 150, and water is the least popular at close to 100 bottles. Overall, coffee sales are roughly four times those of water, and coffee and tea together lead the café's sales by a wide margin.
Practice graph 12: cinema tickets and streaming subscriptions in one town, thousands (grouped bars over time)
| Year | Cinema tickets | Streaming subscriptions |
|---|---|---|
| 2021 | 80 | 40 |
| 2022 | 74 | 52 |
| 2023 | 70 | 63 |
| 2024 | 65 | 75 |
The grouped bar graph compares cinema tickets sold and streaming subscriptions in one town from 2021 to 2024, in thousands. Cinema tickets declined every year, from 80,000 to 65,000. In contrast, streaming subscriptions climbed steadily, from 40,000 to 75,000, almost doubling. Cinema stayed ahead until 2023, at 70,000 against 63,000, but streaming overtook it in 2024. Overall, the two trends moved in opposite directions.
How Do You Score High on a Bar Graph?
To score high, mention the key figures but not every bar, keep speaking at an even pace to a conclusion, and practice on varied graphs under real timing. Use a simple practice loop: take one bar graph, plan for 25 seconds, record for 40 seconds, then review the recording against Content, Pronunciation and Oral Fluency. Time every attempt, and check that you reach the conclusion before the progress bar ends.
Summarize runs of numbers instead of reading each one. Say "orders rose every year, from 12,000 to 41,000" rather than listing all six values, because Pearson tells you to prioritize the most significant data points within 40 seconds. Avoid these five mistakes.
- Reading out every bar instead of the key figures.
- Filler sounds, restarts and long pauses.
- Listing numbers with no comparison between them.
- Adding opinions the graph doesn't show.
- Stopping before a conclusion.
How Does the Bar Graph Fit Into Describe Image?
The bar graph is one image type inside Describe Image, so every timing and scoring rule comes from that one task. Line graphs, pie charts, tables, maps and process charts follow the same 25-second and 40-second rhythm. Our PTE describe image guide covers the task as a whole.
How Is a Line Graph Different From a Bar Graph?
A line graph shows change over time through one or more lines, so the answer follows trends; a bar graph compares separate values, so the answer follows comparisons. When bars run across years, the vocabulary section supplies the trend verbs you need. See the PTE line graph guide for the full trend method.
How Is a Pie Chart Different From a Bar Graph?
A pie chart splits a total into slices, each a share of one whole, so its figures add up to 100%. That turns fractions such as "about a quarter" into accurate shortcuts, while a bar graph answer needs comparisons between separate values. Because a pie chart shows parts of one whole, our guide to describing a pie chart focuses on proportion words rather than bar-by-bar comparisons.
How Is a Table Chart Different From a Bar Graph?
A table chart lays out figures or short entries in a grid, and some tables hold words instead of numbers, leaving nothing to rank. Pearson publishes no table-specific rules, so the same Describe Image advice applies: use numbers from the image without mentioning every feature.
A table gives exact figures in rows and columns instead of bars. Our PTE table chart guide shows which figures to pick out for a 40-second answer.
Does the 3-Second Rule Apply to a Bar Graph?
Pearson writes the 3-second rule inside its Answer Short Question instructions and adds that "this also applies to" Describe Image, along with Read aloud, Repeat Sentence and Re-tell Lecture. So the rule covers a bar graph too: if you stop for three seconds while speaking, the recording status changes to "Completed" and you can't continue.
Silence is the risk, so start right after the short tone and follow Pearson's advice not to stop for more than a second or two once you start. Read more on the 3-second rule in PTE speaking.
How Do You Improve Oral Fluency for Bar Graph Answers?
Oral fluency on a bar graph improves when you practice saying numbers and category names smoothly, without stopping to recheck them. Pearson penalizes hesitations, repetitions and false starts in this trait. Saying numbers aloud from the practice graphs above, such as "48,000" and "one and a half times", trains them to come out at your normal pace. Our guide to oral fluency in PTE adds more drills.
Practice PTE Speaking on EasyEnglish
Try Speaking tasks in a timed, computer-based format like the real test.
Try speaking practice without signing up. A free account is required for full mock tests. Practice scores are estimates, not official Pearson scores.
Written by
EasyEnglish Team
The team behind EasyEnglish's PTE practice and mock tests
EasyEnglish provides PTE practice and independent preparation guides. Official test rules are checked against the sources identified in each guide; practice examples are illustrative, not real exam questions. Practice scores are estimates. Questions or corrections: support@inverseai.com. EasyEnglish is not affiliated with or endorsed by Pearson.
Editorial review completed .