PTE Speaking Table Chart: Process, Template and Tips
PTE Speaking
A table chart in PTE Speaking hands you a grid of numbers or words and 40 seconds to make sense of it out loud. The table arrives as the image in a Describe Image item, and you get 25 seconds to scan its rows and columns. Then you describe two or three main patterns with their figures and close with what the data suggests.
Pearson runs one Describe Image task and publishes no table-specific rules, so every tip here applies Pearson's Describe Image guidance to tables. That guidance says to use numbers from the image, not to mention every feature, and to stick to what you can see instead of adding opinions. Ten original practice tables with model answers follow the method.
Table of Contents
What Is a Table Chart in PTE Describe Image?
In PTE, a table chart is a grid of rows and columns holding figures or short entries, shown as the image in a Describe Image item. You say what it compares, give two or three patterns with their figures, and end with what the data suggests. Pearson treats Describe Image as one task, and its July 2021 article lists "table" among the possible images. PTE Academic and PTE Core both include Describe Image.
What Information Does a Table Chart Usually Show?
A table usually compares a few categories across a few years, places or measures, with a unit such as percentages, numbers or money in the header. Read these five parts once, in this order, before you look at a single figure.
- The title, for topic, place and time
- The row labels, which name the categories
- The column labels, for years, places or measures
- The unit, such as percent, thousands or dollars
- Any total row or column
Pearson's do's and don'ts article warns against spending too much time on labels. Read them once so you know what the numbers mean, then move straight to the figures.
Some tables hold words instead of numbers. With nothing to rank, describe what repeats, what differs between columns and what the overall status is, then add a conclusion.
- A timetable: "Math appears every morning, while art and music come only once a week."
- A product comparison: "Laptop X leads on battery life and price, whereas Laptop Y doubles the memory."
- A status list: "Only one of the five projects is finished, and one is on hold."
How Does the Table Chart Task Work?
The table appears on screen, you have 25 seconds to study it, the microphone opens after a short tone, and you have 40 seconds to speak, recorded once. Pearson gives every Describe Image item the same timing, whether the image is a table, a graph or a map.
| Stage | Time or rule |
|---|---|
| Study the table | 25 seconds |
| Short tone | Start speaking right after it; speech before the microphone opens isn't recorded |
| Speak | 40 seconds; Pearson says "There is no need to rush" |
| Silence | Stopping for three seconds while speaking ends the recording |
| Finish | Before the progress bar reaches the end |
| Recording | Once only |
| Notes | Erasable noteboard |
Pearson lists Describe Image among the item types where a three-second stop changes the status to "completed," and you can't continue after that. Pearson's PTE Academic Score Guide (2025) sets 5-6 Describe Image items per test, and the PTE Core Score Guide (2026) sets 3-4. Pearson doesn't say how many will be tables, so plan for the method, not a number of tables.
What Do Examiners Expect in a Table Chart Answer?
A table answer is scored like any Describe Image answer: Content, Pronunciation and Oral Fluency, with partial credit. Content rewards the main parts of the table, the relationships between figures, possible developments and a conclusion or implication. Each trait asks something specific of a table.
| Trait | What it means for a table |
|---|---|
| Content | Give the key patterns with figures, one comparison and a likely development or conclusion. |
| Pronunciation | Say numbers and category names so most listeners understand them at once. |
| Oral Fluency | Keep rhythm, phrasing and stress smooth through the figures, with no false starts. |
In PTE Academic, AI scores all three traits, and a human expert also reviews Content before the task score is confirmed. The current Academic Score Guide (2025) rates Content from 0 to 6 and Pronunciation and Oral Fluency from 0 to 5; in PTE Core, Content runs 0-5. Pearson's July 2021 speaking article adds that scoring above 1 on Content needs the relationships between parts of the image, possible developments and conclusions or implications. The Academic and Core Score Guides publish 0-5 scales for Pronunciation and (Oral) Fluency. Pearson also gives no credit for an unoriginal response, so the words must be your own.
How Do You Describe a Table Chart in PTE?
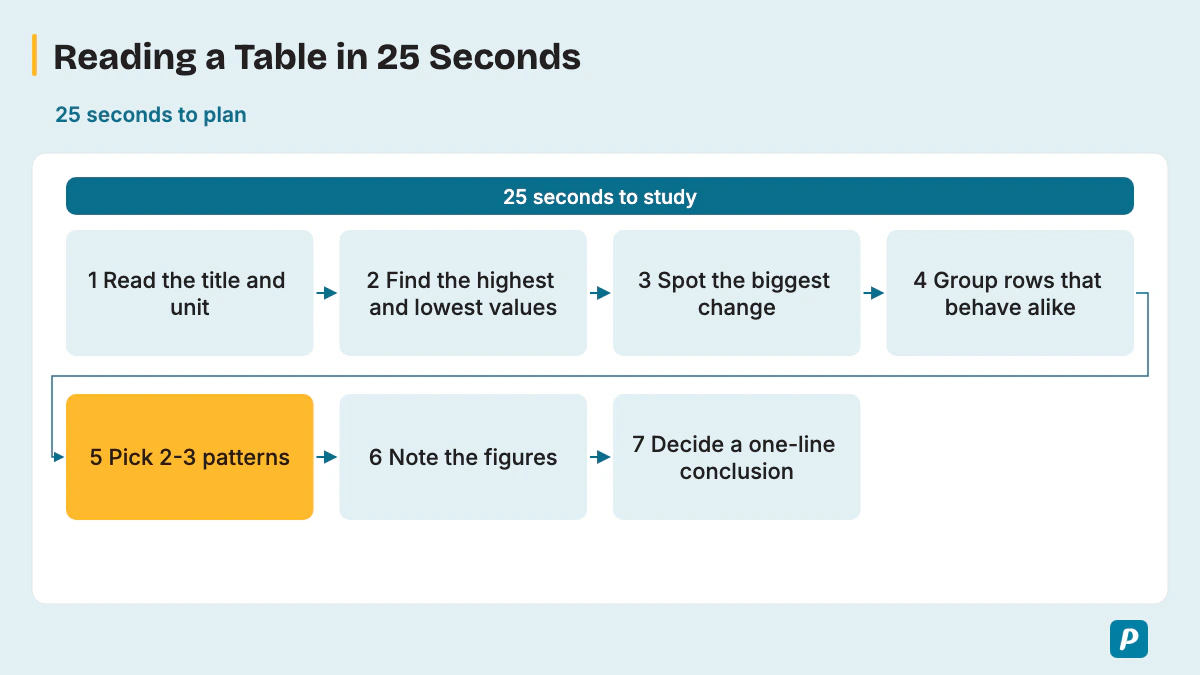
Read the title and labels, find the highest and lowest values, spot one big change, group rows that behave alike, and decide a one-line conclusion; never read the table figure by figure. Seven steps fit inside the 25 seconds.
- Read the title and the unit.
- Scan for the highest value and the lowest value.
- Look for the biggest change across a row or column.
- Group rows or columns that behave alike.
- Pick two or three patterns in total, as Pearson advises finding the key trends and the most significant one.
- Note those figures on the noteboard.
- Decide your one-line conclusion.
Grouping saves time because one sentence covers two rows. Try "Canada and Mexico show almost the same figures" or "In 2022 and 2023, the values stayed level." Pearson also advises using numbers from the image without trying to mention every feature. Plan how to say exact figures clearly; use an explicitly approximate value only when the chart itself requires estimation.
Is There a Table Chart Template for PTE?
There's no safe fill-in table chart template: Pearson says memorized responses or templated sentences can lead to a score of 0 for Content, and then Fluency and Pronunciation aren't scored. Pearson's own three-part structure fits a table without fixing your words.
- General content: say what the table compares, where and when.
- Main point: give the highest and lowest values or the biggest change, with figures.
- Other details and conclusion: add one more pattern and what the data suggests.
Some prep sites still quote fixed slots of 0-5, 5-30 and 30-40 seconds and say to finish around 35 seconds; Pearson's current page says to aim to speak for 30-40 seconds. Treat any slot split as a rough pacing guide, not a rule.
What Words and Sentence Patterns Describe a Table?
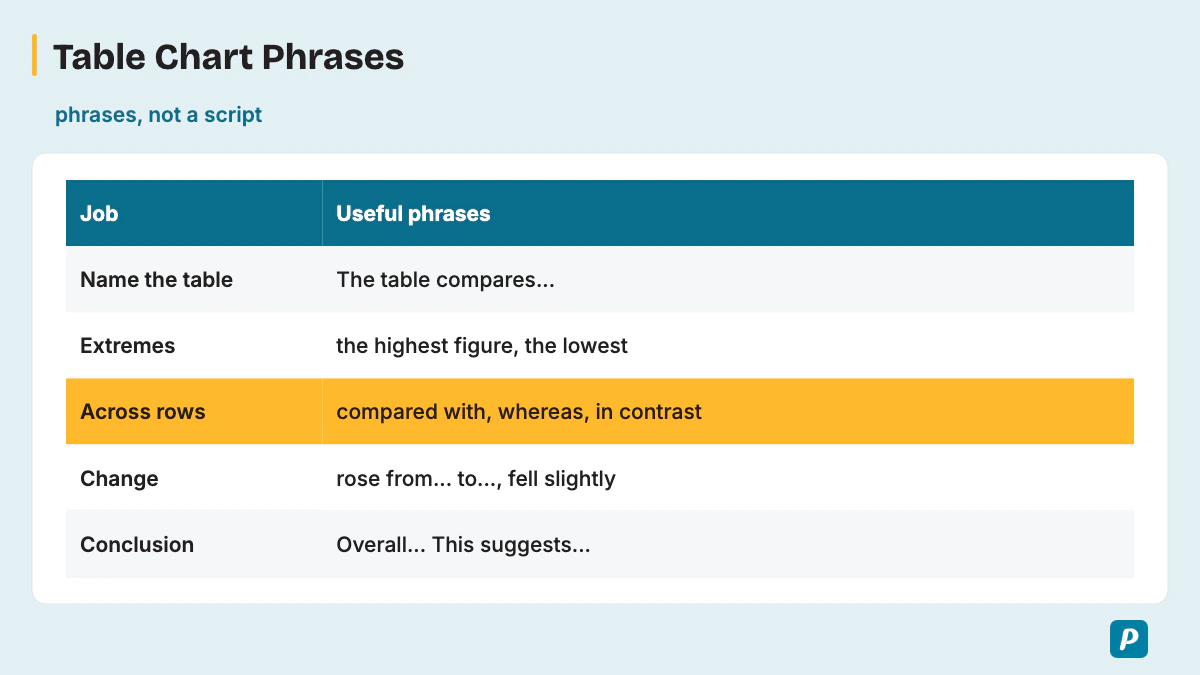
Table answers lean on comparison and change language: superlatives for the extremes, comparatives across rows or columns, change words when the columns are years, and quantity words for rounding. The phrase bank sorts more than 60 sentence patterns by the job each one does.
| Job | Useful phrases |
|---|---|
| Name the table | "The table compares...", "The table gives figures for...", "The table shows...", "The data covers...", "...broken down by..." |
| Extremes | "the highest figure", "the lowest", "the largest share", "the smallest number", "ranked first", "came last", "topped the list" |
| Across rows or columns | "compared with", "whereas", "in contrast", "while", "higher than", "lower than", "twice as many as", "unlike" |
| Grouping similar rows | "Both X and Y...", "X and Y show similar figures", "X, Y and Z all...", "the remaining categories", "likewise", "similarly" |
| Rising change | "rose from ... to ...", "increased by", "grew steadily", "climbed to", "peaked at", "nearly doubled", "almost tripled" |
| Falling or flat change | "fell slightly", "dropped to", "declined by", "decreased sharply", "remained stable", "stayed level", "fluctuated slightly" |
| Quantity and rounding | "approximately doubled", "just under", "just over", "accounted for nearly 30%", "a marginal difference of", "roughly a quarter", "about half" |
| Time references | "between 2015 and 2025", "by the end of the period", "over the three years", "in the first year", "throughout the period" |
| Connectors | "also", "however", "as", "besides", "apart from that", "at the same time" |
| Conclusion and implication | "Overall,...", "This suggests...", "In short,...", "The main point is that...", "This indicates..." |
Use these inside your own sentences; don't memorize a paragraph, because Pearson says templated sentences can score 0 for Content. Superlatives such as "the highest figure" handle the extremes, comparatives such as "higher than" link two rows, and "whereas" sets them side by side in one sentence. "Rose from" carries a change with both figures, and the first four connectors in the table are Pearson's own examples.
What Are Common Table Chart Mistakes?
The costly mistakes are reading every cell, stumbling over long numbers, mixing up rows and columns, adding your own opinion, and ending without a conclusion. Each one below names the trait it costs and the fix.
- Reading every cell eats the 40 seconds and buries the main patterns, so Content drops; pick two or three.
- Restarting long numbers mid-figure breaks the smooth rhythm Oral Fluency rewards; plan their spoken forms before recording.
- Pausing for three seconds while you hunt for a figure ends the recording, so keep talking and move to the next point.
- Reading a figure from the wrong row or column puts a false claim into Content; check the label before you note it.
- Adding a personal opinion moves the answer away from the image, and no personal insight earns a bonus. Pearson's Describe Image guidance says "Stick to describing the elements you can see in the image."
- Rushing blurs numbers for Pronunciation, and Pearson's format page says "There is no need to rush."
- A memorized opening that ignores the table risks a score of 0 for Content, which also leaves Fluency and Pronunciation unscored.
- Ending with no conclusion or implication leaves Content short of the relationships and conclusions Pearson rewards.
What Does a Table Chart Sample Answer Look Like?
A sample answer names what the table compares, gives the highest and lowest figures or the biggest change, then adds one more pattern and a conclusion, in about 30-40 seconds of speech. Each practice table below uses illustrative values, not real data, and every table and model answer was written for this article. Study one table for 25 seconds, record your own answer for 40 seconds, then compare it with the model.
Practice Table 1: Museum Visitors (thousands)
| Museum | 2015 | 2025 |
|---|---|---|
| Science Museum | 120 | 180 |
| Art Gallery | 90 | 85 |
| History Museum | 60 | 110 |
The table compares visitor numbers at three city museums in 2015 and 2025. The Science Museum had the highest figure in both years, and its visitors rose from 120,000 to 180,000. The History Museum grew fastest, almost doubling from 60,000 to 110,000. In contrast, the Art Gallery fell slightly, from 90,000 to 85,000. Overall, this suggests that interest in science and history grew, whereas visits to the gallery held roughly steady.
In this annotated answer, the first sentence is General content. The second and third sentences are the Main point. The comparison words "the highest figure," "rose from" and "almost doubling" carry it. The last two sentences give Other details and the conclusion, with "In contrast," "fell slightly" and "whereas."
Practice Table 2: Share of Household Spending (%)
| Country | Food | Housing | Transport | Leisure |
|---|---|---|---|---|
| Country A | 28 | 25 | 12 | 6 |
| Country B | 15 | 32 | 14 | 10 |
| Country C | 21 | 27 | 18 | 8 |
| Country D | 17 | 30 | 13 | 12 |
The table shows how households in four countries divide their spending across four categories. Housing takes the largest share in three countries, peaking at 32% in Country B. Country A is the exception, as food accounts for 28% there, nearly double Country B's 15%. Leisure is the smallest category everywhere, ranging from 6% in Country A to 12% in Country D. Overall, housing and food together take roughly half of spending in every country.
Practice Table 3: Two Laptops Compared
| Feature | Laptop X | Laptop Y |
|---|---|---|
| Screen | 13.6 inches | 14 inches |
| Battery life | Up to 18 hours | Up to 12 hours |
| Memory | 8 GB | 16 GB |
| Storage | 256 GB | 512 GB |
| Weight | 2.7 pounds | 3.1 pounds |
| Price | $1,099 | $1,349 |
The table compares two laptops across six features. Laptop X lasts up to 18 hours on a charge, six hours longer than Laptop Y, and it's lighter at 2.7 pounds. Laptop Y, however, doubles the memory to 16 gigabytes and the storage to 512 gigabytes, with a slightly larger 14-inch screen. Laptop X is also $250 cheaper. Overall, Laptop X leads on battery, weight and price, whereas Laptop Y leads on memory and storage.
Practice Table 4: A Soccer Team's Monthly Results
| Month | Played | Won | Tied | Lost | Points |
|---|---|---|---|---|---|
| September | 4 | 1 | 1 | 2 | 4 |
| October | 5 | 4 | 0 | 1 | 12 |
| November | 4 | 2 | 1 | 1 | 7 |
| December | 3 | 0 | 2 | 1 | 2 |
The table shows a soccer team's results and points over four months. October was clearly the best month, with four wins from five matches and 12 points. December was the weakest, with no wins and only 2 points from three games. September and November fell in between, with 4 and 7 points. Overall, the team peaked in October and then declined, which suggests its form faded toward the end of the year.
Practice Table 5: A Company's Finances ($ thousands)
| Item | 2022 | 2023 | 2024 |
|---|---|---|---|
| Revenue | 250 | 310 | 400 |
| Costs | 200 | 230 | 260 |
| Profit | 50 | 80 | 140 |
The table gives a small company's revenue, costs and profit from 2022 to 2024. Revenue rose from 250,000 to 400,000 dollars, an increase of 60%. Costs also grew, but more slowly, from 200,000 to 260,000 dollars. As a result, profit almost tripled, climbing from 50,000 to 140,000 dollars. Overall, revenue grew faster than costs every year, which indicates the company is becoming more profitable.
Practice Table 6: A Weekly School Timetable
| Time | Monday | Tuesday | Wednesday | Thursday | Friday |
|---|---|---|---|---|---|
| 9:00 | Math | English | Math | Science | Math |
| 10:00 | English | Math | Science | Math | English |
| 11:00 | Science | History | English | English | Science |
| 12:00 | Lunch | Lunch | Lunch | Lunch | Lunch |
| 1:00 | Art | P.E. | Music | History | P.E. |
The table shows a school's weekly timetable from Monday to Friday. Math and English are the core subjects, appearing every day and always in the morning. Science comes four times, missing only Tuesday, and history appears twice, once in the morning and once after lunch. After lunch at 12:00, the afternoon slot mostly holds lighter subjects, such as art, music and P.E. Overall, the timetable puts most academic subjects in the morning and creative or physical lessons after lunch.
Practice Table 7: Four Cities by Population and Area
| City | Population | Area (sq km) | People per sq km |
|---|---|---|---|
| Northport | 4,250,000 | 850 | 5,000 |
| Easton | 2,100,000 | 1,050 | 2,000 |
| Riverton | 1,480,000 | 370 | 4,000 |
| Lakeside | 640,000 | 320 | 2,000 |
The table compares the population, area and density of four cities. Northport is the largest, with about 4.25 million people and the highest density at 5,000 per square kilometer. Easton covers the biggest area, just over 1,000 square kilometers, yet its density is only 2,000, the same as tiny Lakeside. Riverton is small but crowded, at 4,000 people per square kilometer. Overall, a larger area doesn't mean a denser city.
Practice Table 8: Medal Table for Four Teams
| Team | Gold | Silver | Bronze | Total |
|---|---|---|---|---|
| Team North | 12 | 8 | 5 | 25 |
| Team South | 9 | 11 | 10 | 30 |
| Team East | 7 | 6 | 9 | 22 |
| Team West | 3 | 5 | 12 | 20 |
The table lists gold, silver and bronze medals for four teams. Team North won the most gold medals, 12, but Team South won the most medals overall, with 30. Team West came last with 20 medals, yet it won the most bronze, 12. Team East came third with 22. Overall, the ranking depends on the measure, since the gold leader isn't the team with the highest total.
Practice Table 9: Weekly Rent by Apartment Size ($)
| District | 1-bedroom | 2-bedroom | 3-bedroom |
|---|---|---|---|
| Central | 450 | 650 | 900 |
| Harbor | 380 | 540 | 720 |
| Westfield | 260 | 370 | 500 |
The table shows weekly rents for three apartment sizes in three districts. Central is the most expensive in every size, reaching 900 dollars a week for three bedrooms. Westfield is the cheapest, starting at 260 dollars, and its rents are a little over 40% lower than Central's for each size. Harbor sits in between. Overall, rent climbs with every extra bedroom, and a one-bedroom in Central costs almost as much as a three-bedroom in Westfield.
Practice Table 10: Project Status List
| Project | Lead | Deadline | Status |
|---|---|---|---|
| New website | Priya | March 15 | Completed |
| Mobile app | Daniel | April 30 | In progress |
| Staff training | Mei | May 10 | In progress |
| Customer survey | Omar | June 1 | Not started |
| Office move | Lucia | July 20 | On hold |
The table lists five projects with their leads, deadlines and current status. Only the new website, led by Priya, is completed, and it had the earliest deadline, March 15. Two projects, the mobile app and staff training, are in progress, with deadlines in April and May. The customer survey hasn't started, and the office move, due last on July 20, is on hold. Overall, the projects with earlier deadlines are further along.
How Do You Score High in a PTE Table Chart?
To score high, pick two or three key patterns with their figures instead of every cell, keep a steady pace through the numbers, and always end with what the data suggests. Run a tight practice loop: one table, a 25-second plan, a 40-second recording, then a review against the three traits.
During the 25 seconds, say each rounded figure once under your breath so it comes out smoothly on the recording. Rotate varied tables, from three-row grids to word-only timetables, so the conclusion becomes a habit on every shape.
How Does the Table Chart Fit Into Describe Image?
The table chart is one image type inside Describe Image, so every timing and scoring rule comes from that one task. Our PTE describe image page covers the task as a whole, including the other image types.
How Is a Bar Graph Different From a Table Chart?
A bar graph already draws the comparison for you in bar lengths; a table gives only the numbers, so you have to find the highest, lowest and biggest change yourself. Reading a table therefore demands more of your 25 seconds. The PTE bar graph page shows the comparison method for bars.
How Is a Pie Chart Different From a Table Chart?
A table sets out many figures in rows and columns, so your answer picks two or three patterns. A pie chart turns the figures into shares of one whole, and our guide to pie chart answers lists the words for describing those proportions. Because the slices add up to 100%, fractions such as "about a quarter" work as accurate shortcuts.
How Do You Practice Table Chart Samples?
Turn the ten table chart samples above into recorded practice: record each once, with a 25-second plan and a 40-second answer, then listen back with this checklist.
- Fillers such as "uh" and "um"
- Pauses long enough to risk the three-second cut-off
- A flat, monotone voice with no stress on key figures
- A pace that's too fast or too slow
- Restarting the whole answer after one slip
- A missing conclusion
Write each slip on a running error list and read it before your next session. The benefits of online PTE practice include real timing and recordings you can replay.
How Do You Improve Oral Fluency for Table Chart Answers?
Oral fluency on a table improves when you practice saying long numbers and category names smoothly, rounding where it helps, without stopping to recheck a cell. Rounding turns a hard figure into a short phrase you can say at a steady pace, so plan the spoken form of each figure during the 25 seconds.
| Written | Say it as |
|---|---|
| 8,420,000 | "about eight point four million" |
| 32.14% | "just over thirty-two percent" |
| $194,000 | "one hundred ninety-four thousand dollars" |
| 2015 | "twenty fifteen" |
| 15-20% | "between fifteen and twenty percent" |
| 118,600 | "almost one hundred twenty thousand" |
Pearson's July 2021 article adds two tips. If you're unsure how to pronounce a word on the image, say it the way you think it's said and keep going. Pearson recommends connectors such as also, however, as or besides to link your points. Our guide to oral fluency in PTE adds drills.
Practice PTE Speaking on EasyEnglish
Try Speaking tasks in a timed, computer-based format like the real test.
Try speaking practice without signing up. A free account is required for full mock tests. Practice scores are estimates, not official Pearson scores.
Written by
EasyEnglish Team
The team behind EasyEnglish's PTE practice and mock tests
EasyEnglish provides PTE practice and independent preparation guides. Official test rules are checked against the sources identified in each guide; practice examples are illustrative, not real exam questions. Practice scores are estimates. Questions or corrections: support@inverseai.com. EasyEnglish is not affiliated with or endorsed by Pearson.
Editorial review completed .