PTE Speaking Pie Chart: Process, Template and Tips
PTE Speaking
A pie chart has just appeared in PTE Speaking, and the microphone opens in 25 seconds. That pie chart is the image in a Describe Image item. You study its slices, then you get 40 seconds to say what the whole is, which slices lead, how they compare and what the chart suggests.
Pearson's Speaking Test Tips (V6, January 2026) say the Describe Image picture "will most likely be a graph, table or pie chart". Pearson still runs one Describe Image task with no pie-chart-specific rules, so every rule here is a Describe Image rule applied to slices.
Pearson's PTE Academic Test Taker Score Guide scores the answer on Content (0-6), Pronunciation (0-5) and Oral Fluency (0-5), and Pearson's own advice is to use numbers from the image without trying to mention every feature. The 12 practice charts further down all add up to 100%, and each answer uses only its own chart's figures.
Table of Contents
What Is a Pie Chart in PTE Describe Image?
In PTE, a pie chart is a circle divided into slices, shown as the image in a Describe Image speaking item, where each slice is a share of one whole, usually in percentages. Your answer says what the whole is, names the largest and smallest slices with their figures, compares one or two others and ends with what the chart suggests. Because every slice is a proportion of total, the figures add up to 100%, which makes fractions such as "about a quarter" accurate shortcuts.
Pearson's 2021 speaking article says the Describe Image picture "could be a graph, picture, map, chart or table", and Pearson doesn't name pie charts as a separate task. PTE Academic and PTE Core both include Describe Image.
What Is the PTE Pie Chart Format?
The pie chart appears on screen, you have 25 seconds to study it, the microphone opens after a short tone, and you have 40 seconds to speak, recorded once. Here is how a single pie chart item runs from screen to recording.
| Step or rule | Detail |
|---|---|
| Study the chart | 25 seconds |
| Short tone | Microphone opens after it |
| Speak | 40 seconds |
| Finish | Before the progress bar ends |
| Recording | Once only |
| Notes | Erasable noteboard |
| Items per PTE Academic test | 5-6 Describe Image questions (Score Guide) |
Pearson's PTE Academic Test Taker Score Guide lists 5-6 Describe Image questions per test but gives no chart-type mix, so no Pearson source says how many will be pie charts. Pearson's Speaking Test Tips do name the pie chart as one of the three most likely image types, with graphs and tables. The 3-second rule also applies: Pearson says that if you stop for three seconds while speaking, the recording status changes to completed, and that rule covers Describe Image.
How Do You Describe a Pie Chart in PTE?
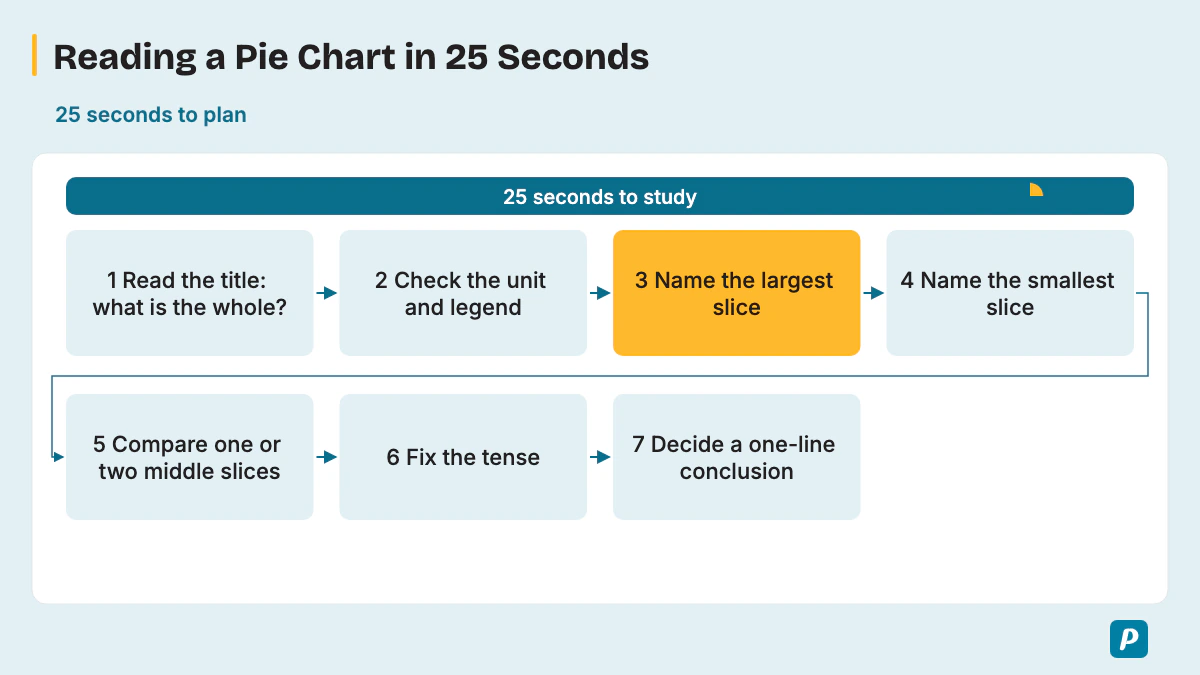
Read the title to learn what the whole is, find the largest and smallest slices, pick one or two other slices worth comparing, and decide a one-line conclusion. Seven quick checks fill the 25 seconds of study time.
- Read the title to learn what the whole is, where and when.
- Check the unit and the legend, so you know whether slices show percentages or amounts and which color is which category.
- Name the largest slice with its figure.
- Name the smallest slice with its figure.
- Compare one or two middle slices, such as two that are close in size.
- Fix the tense: past for a past year, present for current data, "is expected to" for a projection.
- Decide your one-line conclusion about what the chart suggests.
With two pie charts, compare the biggest change between them instead of describing each chart in full; Samples 2 and 7 below show how. Pearson's Speaking Test Tips also say to include the type of image in your answer, so open with "The pie chart shows...".
Pearson's Describe Image advice adds four limits: use numbers from the image, don't try to mention every feature, don't spend too long on labels, and avoid personal opinions. In Pearson's words, "Stick to describing the elements you can see in the image."
Pearson's 2021 speaking article suggests connectors such as "also", "however", "as" and "besides". If a category name on the chart is unfamiliar, say it the way you think it's pronounced and keep going. A slice close to half or a quarter can simply be called that, and five to seven short sentences fill 40 seconds.
The 40 seconds split roughly into four parts. This is a practice habit for pacing, not a Pearson rule; Pearson's own target is 30-40 seconds of speech.
| Part | Seconds | What you say |
|---|---|---|
| Name the chart | About 5 | What the whole is, where and when |
| Largest and smallest | About 15 | Both slices with their figures |
| One or two more slices | About 10 | A comparison between middle slices |
| Conclusion | About 5 | What the chart suggests overall |
What Are the Scoring Criteria for a Pie Chart in PTE?
A pie chart answer is scored like any Describe Image answer: Content, Pronunciation and Oral Fluency, with partial credit. Content rewards covering the main slices, how they relate and a conclusion or implication. Pearson's Score Guide gives each trait its own scale, translated into pie chart terms here.
| Trait | Score Guide scale | What it means for a pie chart |
|---|---|---|
| Content | Academic: 0-6; Core: 0-5 | Give the main slices with figures, how they relate and a conclusion. |
| Pronunciation | 0-5 | Say percentages and category names clearly. |
| Oral Fluency | 0-5 | Keep an even pace through the figures, with no restarts. |
The Score Guide scores Content first, and a Content score of 0 means no further scoring for that item. A response built on significant pre-prepared or memorized material gets 0 for Content. Level 1 Content is "a list of points identified on the image, without description or elaboration", which is exactly what reading out every slice produces. At level 6, "A listener could build a complete mental picture of the image from the response."
In PTE Academic, AI scores all three traits, and a human expert also reviews Content before the task score is finalized. PTE Core's format page names the same three traits and partial credit but says nothing about human review. Academic Content uses 0-6; Core Content still uses 0-5. Pearson's 2021 speaking article also said Content was worth up to 5 points, and the Score Guide has replaced that figure.
Is There a Pie Chart Template for PTE?
Not a fill-in pie chart template: Pearson says memorized responses or templated sentences can lead to a score of 0 for Content, and then Fluency and Pronunciation aren't scored. Pearson's own three-part structure, applied to slices, gives you shape without a script.
- General content: say what the whole is and when.
- Main point: give the largest and smallest slices with their figures.
- Other details and conclusion: add a middle slice or a comparison, then what the chart suggests.
Pearson's advice is to avoid templated sentences and to speak for 30-40 seconds, because you're "unlikely to mention the key features in 20 seconds or less". Treat the timing table above as a pacing guide only. A stock closing line that would fit any chart, such as "the chart gives useful information", tells the listener nothing about this one.
What Words Describe Pie Chart Proportions?
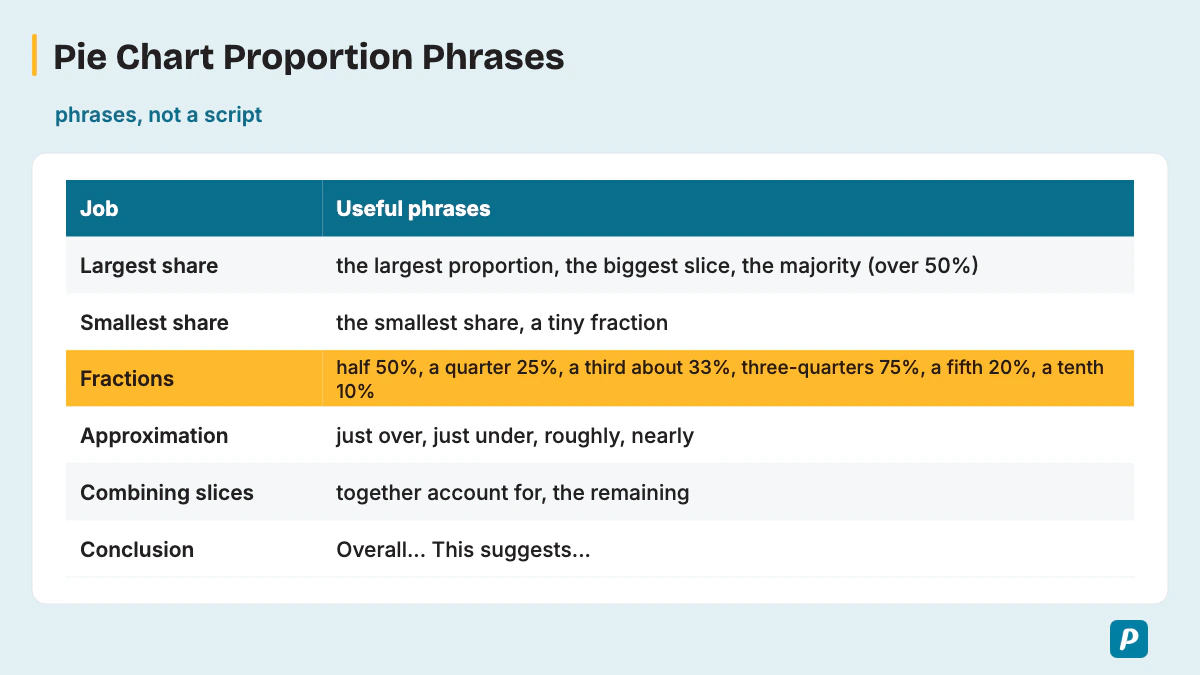
Pie answers run on proportion language: words for the largest and smallest shares, fractions for round figures, and comparison words for slices close in size. The first table groups proportion phrases by the job each one does.
| Job | Useful phrases |
|---|---|
| Name the chart | "The pie chart shows how ... is divided", "The chart breaks down ..." |
| Largest share | "the largest proportion", "the biggest slice", "the majority" (over 50%) |
| Smallest share | "the smallest share", "a tiny fraction", "only" |
| Fractions | "half" (50%), "a quarter" (25%), "a third" (about 33%), "two-thirds" (about 67%), "three-quarters" (75%), "a fifth" (20%), "a tenth" (10%) |
| Approximation | "just over", "just under", "roughly", "nearly", "around" |
| Combining slices | "together account for", "between them make up", "the remaining" |
| Conclusion | "Overall...", "This suggests...", "In short..." |
Comparison words carry the "relationships" that Pearson's Content scoring asks for. The second table sorts them by function, with example sentences written for made-up charts.
| Function | Words | Example sentence |
|---|---|---|
| Similarity | similarly, equally, a similar share, almost the same as | "Rice takes 18%, and similarly, pasta takes 17%." |
| Contrast | whereas, while, in contrast, by comparison | "Cars account for 46%, whereas bicycles account for only 6%." |
| Degree | more than, less than, twice as much as, not as ... as, the same as | "Rent takes twice as much as food, at 40% compared with 20%." |
| Ranking | followed by, second only to, the next largest | "Tea leads with 35%, followed by coffee at 28%." |
| Change between two charts | rose from ... to, fell to, overtook, remained at | "Online sales rose from 12% to 31% and overtook phone orders." |
Simple, accurate words are enough: "shows", "accounts for", "largest" and "smallest" carry most answers, and rare vocabulary earns nothing extra if a figure goes to the wrong slice. A share near 50% is "roughly half", and one near 25% is "about a quarter".
Match the tense to the chart: past tense for a past year, present for current data and "is expected to" for a projection. Reuse these phrases inside your own sentences instead of memorizing a paragraph, and say the exact figure at least for the largest slice. "The majority" only fits a share above 50%, so 34% is "the largest share", never "the majority".
What Are Common Pie Chart Mistakes to Avoid?
The costly mistakes are reading every slice, stopping after a misread number, forgetting what the whole is, and ending without a conclusion. Most of them cost Content, and two cost Oral Fluency.
- Listing every slice in turn produces "a list of points", which is level 1 Content.
- Restarting after a misread figure breaks the even pace that Oral Fluency rewards.
- Skipping what the whole is, such as a budget or a group of people, leaves Content without its anchor.
- Misreading the legend sends a figure to the wrong category and puts an error into your Content.
- Calling a 30% slice "the majority" or "huge" misstates the data, because the majority means over half.
- Describing two charts one after the other, without comparing them, hides the change that Content rewards.
- A memorized opening that ignores the chart risks a score of 0 for Content.
- A personal opinion about the topic breaks Pearson's advice to describe only what you can see.
- A three-second silence while you search for a word ends the recording early.
- No conclusion or implication leaves Content short of its top level.
What Does a Pie Chart Sample Answer Look Like?
A sample answer names what the whole is, gives the largest and smallest slices with their figures, then adds one comparison and a conclusion, in about 30-40 seconds. All 12 practice charts here use illustrative values, not real data, and both the charts and the answers are original practice material, not real exam questions. The slices of every chart add up to 100%, or to the stated total for the dollar chart.
Sample 1: How a charity spends each dollar it raises (one chart, annotated)
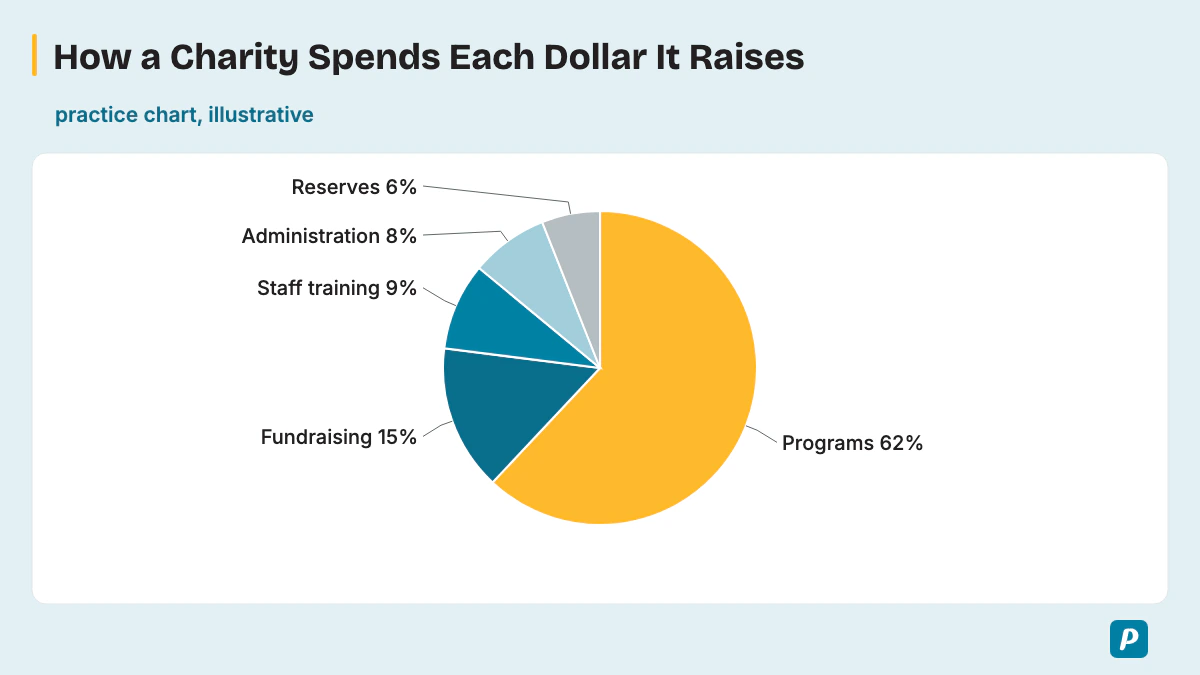
Practice chart (illustrative, not real data): programs 62%, fundraising 15%, staff training 9%, administration 8%, reserves 6%.
[General content] The pie chart shows how a charity spends each dollar it raises. [Main point] Programs take the largest share by far, at 62%, which is well over half of the total. Reserves account for the smallest share, only 6%.
[Other details and conclusion] Fundraising comes next at 15%, while staff training and administration are close together, at 9% and 8%. Overall, most of the money goes directly to the charity's programs, and administration takes less than a tenth.
In the annotated answer, the first sentence is General content. The Main point gives only the largest and smallest slices with their figures, matching the three-part structure above. Other details adds one middle slice and one comparison, then the conclusion says what the split suggests.
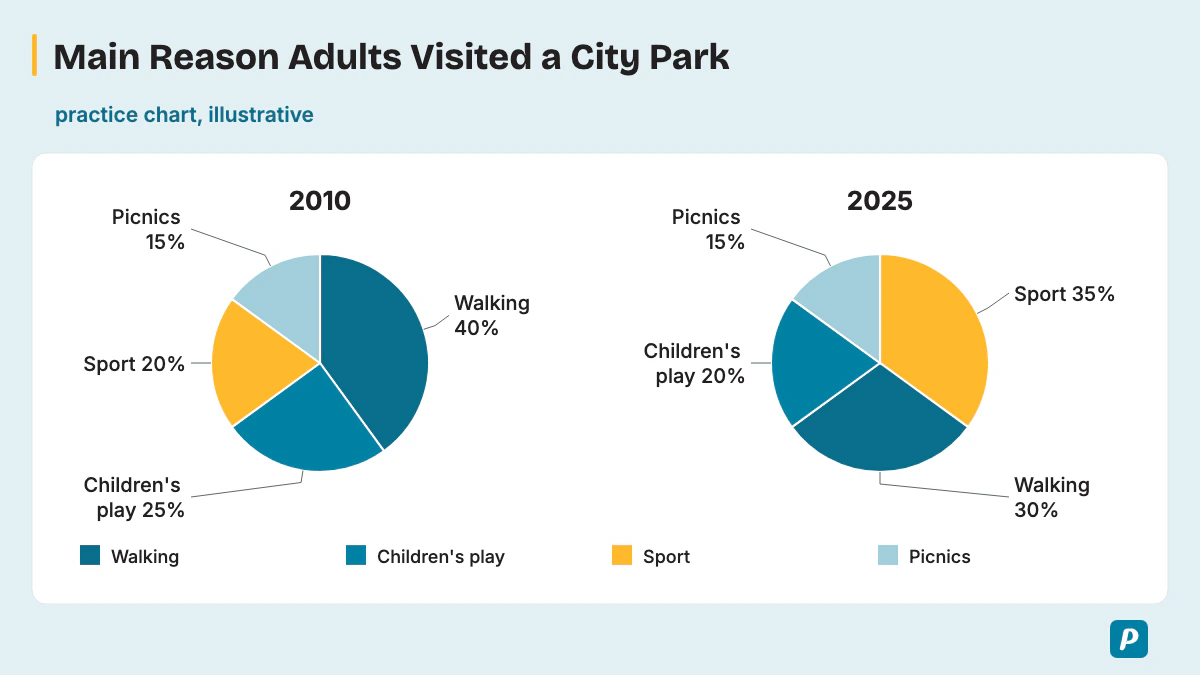
Sample 2: Main reason adults visited a city park, 2010 and 2025 (two charts over time, annotated)
Practice charts (illustrative, not real data): in 2010, walking 40%, children's play 25%, sport 20%, picnics 15%. In 2025, sport 35%, walking 30%, children's play 20%, picnics 15%.
[General content] The two pie charts show the main reason adults visited a city park in 2010 and 2025. [Main point] The biggest change was in sport, which rose from 20% to 35% and overtook walking as the top reason. Walking fell from 40% to 30%.
[Other details and conclusion] Children's play dropped slightly, from 25% to 20%, while picnics remained at 15%. Overall, sport overtook walking as the leading stated reason for visiting the park.
With two charts, the Main point is the biggest change, not the largest slice of each chart. The answer uses past tense because both years have passed, and it names one slice that stayed the same, which helps the listener compare the two charts.
Sample 3: Languages spoken at home by pupils at one school
Practice chart (illustrative, not real data): English 58%, Spanish 17%, Mandarin 11%, Arabic 8%, other languages 6%.
The pie chart shows which languages pupils at one school speak at home. English is the main language for the majority, at 58%. Other languages make up the smallest group, at only 6%. Spanish is second at 17%, followed by Mandarin at 11% and Arabic at 8%.
Together, pupils who speak a language other than English make up 42%. Overall, English leads, but a large minority of pupils speak another language at home.
Sample 4: How a family farm uses its land
Practice chart (illustrative, not real data): wheat 45%, pasture 25%, vegetables 15%, woodland 10%, buildings and yards 5%.
The pie chart breaks down how a family farm uses its land. Wheat covers the largest area, at 45%, which is nearly half the farm. Buildings and yards take the smallest share, only 5%. Pasture for animals covers exactly a quarter, at 25%, while vegetables take 15% and woodland 10%. Overall, wheat and pasture cover 70% of the farm, and buildings use very little land.
Sample 5: Age groups of members at a gym
Practice chart (illustrative, not real data): 18-29 years 34%, 30-44 years 29%, 45-59 years 22%, 60 and over 15%.
The pie chart shows the age groups of members at a gym. The youngest group, aged 18 to 29, is the largest, at 34%, roughly a third of members. Members aged 60 and over form the smallest group, at 15%. In between, the 30 to 44 group makes up 29%, and the 45 to 59 group 22%. Overall, the share of members falls steadily with age, although every age group is well represented.
Sample 6: Causes of train delays in one city in one year
Practice chart (illustrative, not real data): signal faults 31%, weather 24%, staff shortages 19%, passenger incidents 16%, other causes 10%.
The pie chart shows the causes of train delays in one city over a year. Signal faults caused the largest share, at 31%, nearly a third of all delays. Other causes made up the smallest share, at 10%. Weather was the second biggest cause, at 24%, while staff shortages and passenger incidents were close, at 19% and 16%. Overall, signal faults and weather together caused 55% of delays, more than half.
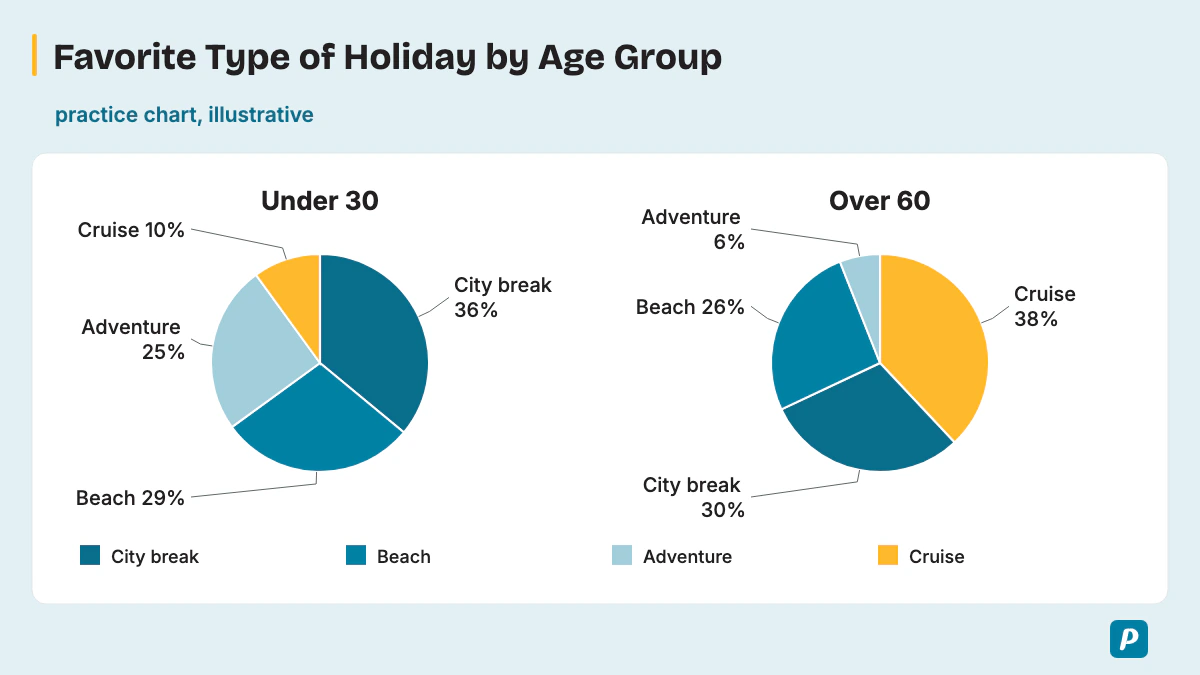
Sample 7: Favorite type of holiday, under-30s and over-60s (two charts, two groups)
Practice charts (illustrative, not real data): under-30s, city break 36%, beach 29%, adventure 25%, cruise 10%. Over-60s, cruise 38%, city break 30%, beach 26%, adventure 6%.
These two pie charts set out the favorite type of holiday for people under 30 and over 60. City breaks are the top choice for under-30s, at 36%, whereas cruises lead for over-60s, at 38%. In contrast, only 10% of the younger group choose a cruise.
Adventure holidays show the opposite pattern, at 25% for under-30s but just 6% for over-60s. Beach holidays are similar in both groups, at 29% and 26%. Overall, the two age groups prefer very different holidays.
Sample 8: Device students use to join a college's online classes
Practice chart (illustrative, not real data): laptop 64%, phone 21%, tablet 11%, desktop computer 4%.
The pie chart shows which device students use to join a college's online classes. Laptops are used by the clear majority, at 64%, nearly two-thirds of students. Desktop computers are the least used, at only 4%. Phones come second at 21%, about a fifth, and tablets account for 11%. Overall, most students join on a portable device, and very few use a desktop computer.
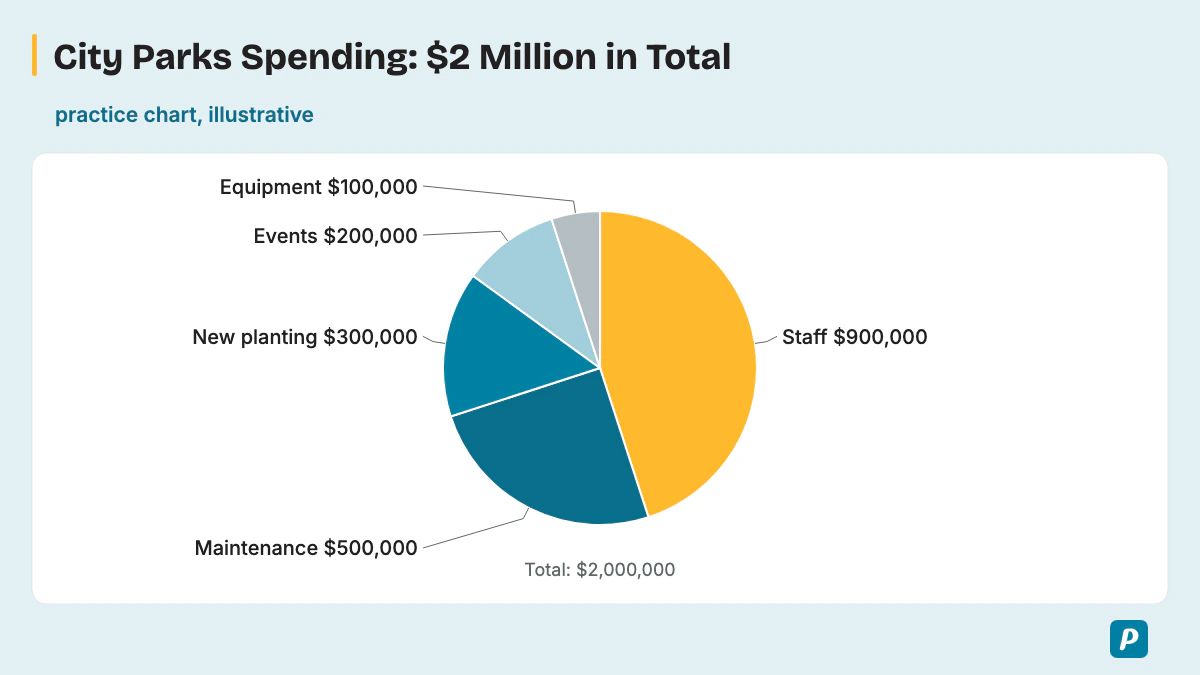
Sample 9: How a city spends $2 million on its parks (amounts, not percentages)
Practice chart (illustrative, not real data): a total of $2 million. Staff $900,000, maintenance $500,000, new planting $300,000, events $200,000, equipment $100,000.
The pie chart shows how a city spends its $2 million parks budget. Staff take the largest amount, $900,000, which is nearly half the total. Equipment receives the smallest amount, only $100,000. Maintenance costs $500,000, exactly a quarter, while new planting gets $300,000 and events $200,000. Overall, people and upkeep take most of the budget, leaving little for new equipment.
Sample 10: Main hobby of members of a community club (slices close in size)
Practice chart (illustrative, not real data): music 22%, reading 21%, gardening 20%, cooking 19%, photography 18%.
The pie chart shows the main hobby of members of a community club. Music is the most popular, at 22%, but only just, because reading follows at 21%. Photography is the least popular, at 18%. Gardening and cooking sit in the middle, at 20% and 19%.
Only four percentage points separate the largest and smallest slices. Overall, the club's members are spread almost evenly across the five hobbies.
Sample 11: Types of complaints received by an airline
Practice chart (illustrative, not real data): flight delays 39%, lost baggage 23%, seating 15%, food 12%, staff behavior 11%.
The pie chart shows the types of complaints an airline received. Flight delays caused the largest share, at 39%, roughly two in five complaints. Staff behavior made up the smallest share, at 11%. Lost baggage was second at 23%, and seating, food and staff together accounted for 38%. Overall, delays and lost bags caused more than three in five complaints.
Sample 12: Why visitors came to an island in 2024
Practice chart (illustrative, not real data): holiday 52%, visiting family 21%, business 15%, study 7%, other reasons 5%.
The pie chart shows why visitors came to an island in 2024. Just over half came for a holiday, at 52%. Other reasons made up the smallest share, at 5%. Visiting family was the second main reason, at 21%, followed by business at 15% and study at 7%. Overall, tourism brought most visitors to the island, while study brought very few.
How Do You Score High in a PTE Pie Chart?
To score high, give the key shares but not every slice, keep speaking at an even pace even after a slip, and always end with what the chart suggests. One practice loop does most of the work: one pie chart, a 25-second plan, a 40-second recording, then a review against the three traits.
Rotate through varied charts so no topic or format surprises you: budgets and spending, market or survey shares, population groups, land or energy use, and paired charts across years or groups. Mix units too, because a chart in dollars or tonnes needs the same method as one in percentages. Time your first sentence and your conclusion, then add slices until you can say the conclusion with about five seconds to spare.
How Does the Pie Chart Fit Into Describe Image?
The pie chart is one image type inside Describe Image, so every timing and scoring rule comes from that one task. Our PTE describe image guide covers the task as a whole, including graphs, tables, maps and pictures.
How Is a Table Chart Different From a Pie Chart?
A table chart lays out many figures in rows and columns, so your answer picks two or three patterns. A pie chart shows shares of one whole, so your answer follows the biggest and smallest slices. Our PTE table chart guide shows how to pick those patterns.
How Many Describe Image Items Are in a PTE Exam?
Pearson's PTE Academic Test Taker Score Guide puts the item count at 5-6 Describe Image questions per test, and no Pearson source says how many of those Describe Image items will be pie charts. Pearson's Speaking Test Tips (V6, January 2026) say the image "will most likely be a graph, table or pie chart", so prepare for a pie chart in every practice session. The PTE exam format page sets out the full test structure.
Which Pie Chart Practice Questions Can You Try?
These practice questions give each chart's data in words only, so you plan and record your own 40-second answer before checking it against the three traits. Every one of these practice charts is illustrative, not real data.
- Radio station broadcast hours: music 55%, news 20%, talk shows 15%, sport 7%, advertising 3%.
- Blood types of donors at one clinic: type O 45%, type A 35%, type B 13%, type AB 7%.
- Ingredients by weight in a granola bar: oats 50%, nuts 20%, honey 15%, dried fruit 10%, seeds 5%.
- Home heating in one town, 1995 and 2025 (two charts): in 1995, oil 45%, gas 35%, wood 15%, electric 5%; in 2025, gas 40%, electric 40%, oil 10%, wood 10%.
- A student's $4,000 semester spending: tuition $2,000, food $800, transport $480, books $400, phone and internet $320.
- Zoo visitors by ticket type: adult 42%, child 33%, senior 15%, student 10%.
- How 200 volunteers heard about a beach clean-up: social media 46%, friends 28%, posters 16%, local radio 10%.
- Bus companies' market share in one city, 2015, 2020 and 2025 (three charts): Company A 50%, 40%, 30%; Company B 30%, 35%, 45%; Company C 20%, 25%, 25%.
Practice 4 tests two charts and practice 8 tests three charts, and practice 5 tests a chart in dollars. Among the benefits of online PTE practice are timed recordings you can replay after each chart.
Does the 3-Second Rule Apply to a Pie Chart?
Yes, Pearson states the 3-second rule in its Answer Short Question block and adds that it also applies to Describe Image. In Pearson's words, if you stop "for three seconds whilst speaking, the recording status will change to completed". The same block says this "also applies to speaking item types Read aloud, Repeat Sentence, Describe Image and Re-tell Lecture".
Start right after the tone, and if a figure slips, move on to the next slice instead of going silent. The 3-second rule in PTE speaking guide gives Pearson's full wording.
What If You Don't Know the Pie Chart Topic?
An unfamiliar topic doesn't stop you, because the chart gives you everything to say: the title, the largest and smallest slices and their figures. Plan your first sentence from the title so you always have a safe start.
Read an unfamiliar category name the way you think it's pronounced, as Pearson's 2021 article advises. Keep talking to stay calm, because a partial description still earns Content and silence earns nothing. Our guide to PTE exam anxiety covers calming routines for test day.
How Do You Improve Oral Fluency for Pie Chart Answers?
Oral fluency on a pie chart improves when you practice saying percentages and category names smoothly, without stopping to recheck them. Saying percentages aloud from practice charts trains your mouth until "twenty-nine percent" comes out as easily as any other phrase. Our guide to oral fluency in PTE adds drills.
Practice PTE Speaking on EasyEnglish
Try Speaking tasks in a timed, computer-based format like the real test.
Try speaking practice without signing up. A free account is required for full mock tests. Practice scores are estimates, not official Pearson scores.
Written by
EasyEnglish Team
The team behind EasyEnglish's PTE practice and mock tests
EasyEnglish provides PTE practice and independent preparation guides. Official test rules are checked against the sources identified in each guide; practice examples are illustrative, not real exam questions. Practice scores are estimates. Questions or corrections: support@inverseai.com. EasyEnglish is not affiliated with or endorsed by Pearson.
Editorial review completed .